- Published on
15 months of 24x7 Primary On-Call - Here's How I Survived
- Authors

- Name
- Danny Mican
I just finished 15 months of primary 24x7 on call. Although it is always stressful to be paged in the middle of the night or on a weekend or holiday I was able to lean on my SRE background to ensure that every alert that woke me up faithfully indicated a critical issue with our system and required human intervention. Here’s how I did it.
Background
I transferred to a team in July of 2020. At the time of joining, the team lacked operational metrics, on-call rotation and alerts. This meant that issues often went undetected until our stakeholders notified us. I formulated an operational maturity model focusing on a foundation of the underlying systems and infrastructure which power the team's pipelines. Ignoring the data flowing through the systems, we began exposing data metrics on our underlying infrastructure starting with:
- Airflow: “cron” solution
- Redshift: AWS Hosted Data Warehouse
- DWH-01: Our EC2 “pet” server
The following is one of the first alerts I went on call for on August 18th 2020!
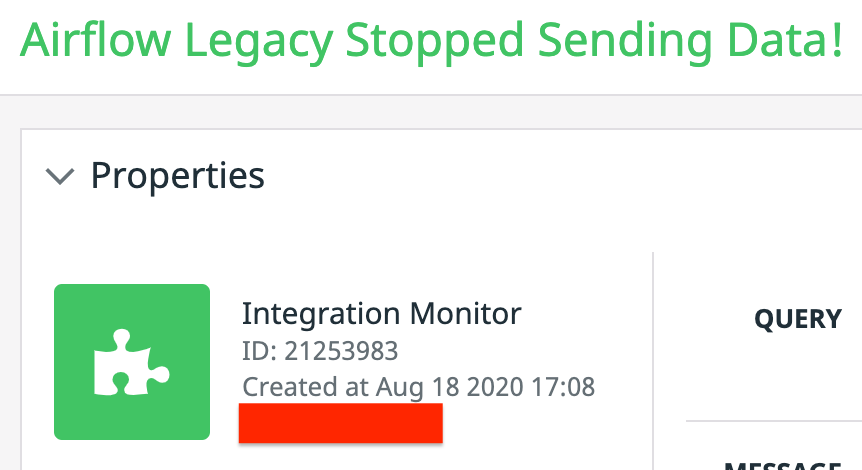
The legacy airflow powers all of the team's ETL pipelines. When it stops it means all ETL pipelines are stopped. When customers report issues it mainly involved jobs that did not run correctly or at all.
Actionable Metrics
The first step to monitoring is to ensure that actionable metrics exist. The “action” in this case is the ability to alert and route alerts of different priorities to different notification channels. When I joined the only alerting available was an airflow slack integration, and a slack notification showing different daily statistics on redshift. The notifications through slack are tightly coupled to the service generating the alerts:
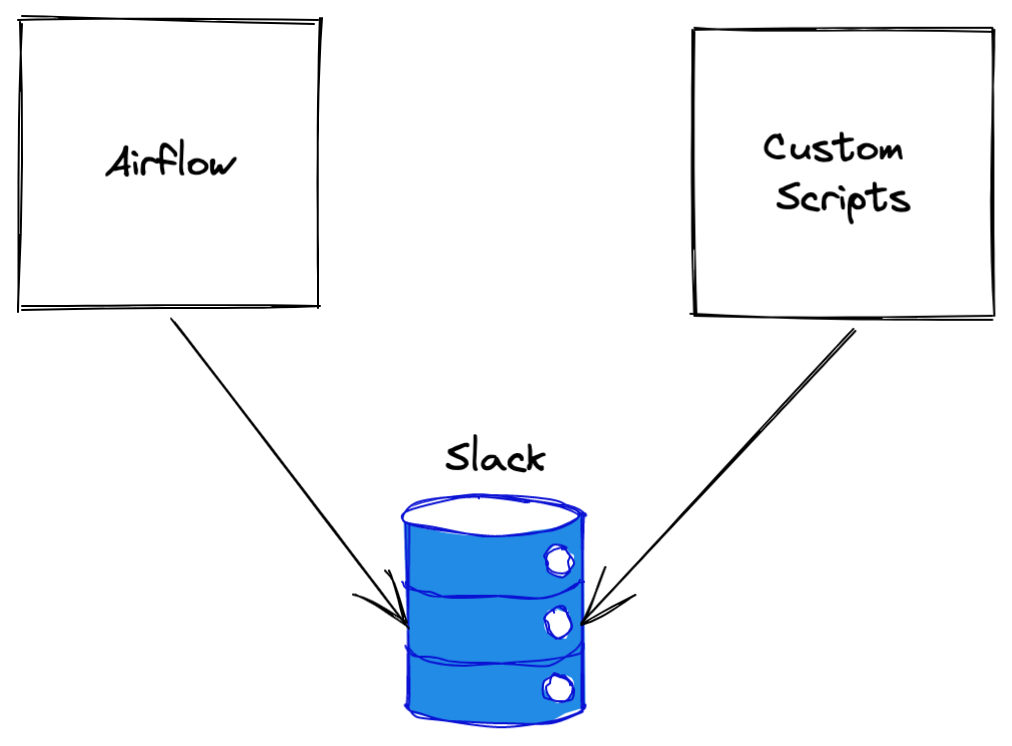
This makes it very difficult to combine metrics and signals from multiple different sources, it also makes it difficult to configure different priority alerts and notification channels. The first step was centralizing metrics in datadog:
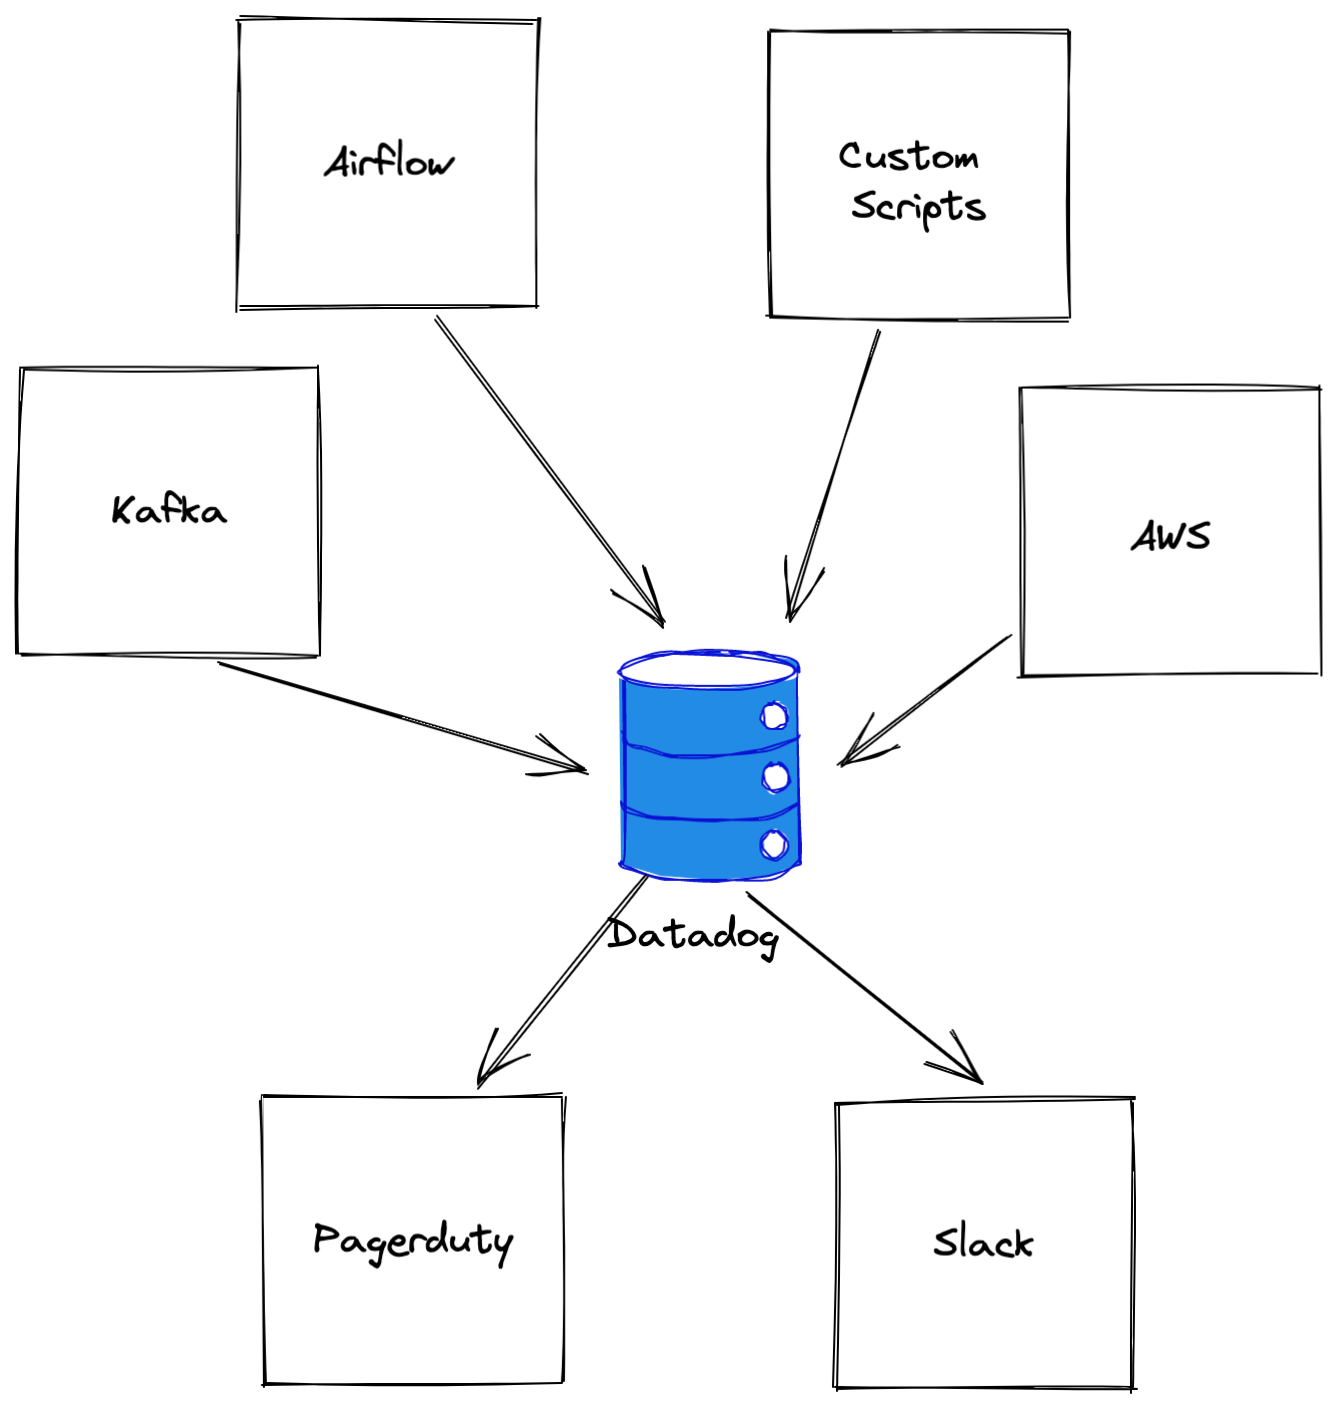
Centralizing metrics in datadog allows us to correlate metrics across systems. It also enables different notification channels for an alert:
- Low priority alerts → Slack
- High Priority Alerts → Slack & Pagerduty
The foundation to on-call was enabling statsd metrics in each of our services and integrations. The goal was to get as much data as possible into datadog. This involved researching & enabling statsd capabilities of services like Airflow, enabling AWS datadog integrations, enabling kafka statsd integrations, and instrumenting custom code to emit statsd metrics to datadog.
The goal is to make it so every single alert that fired was actionable and required human intervention. I'll discuss at the end why I didn’t quite achieve this.
Symptoms Not Causes
Choosing the metrics to alert on is a high impact decision. A poor metric choice could cause flaky non-actionable alerts, which can lead to ignoring alerts, burnout and turnover. Alerting on symptoms increases the actionability of alerts.
An example of a “cause” based alert is an alert on high system resource (CPU, Memory, etc) usage. Imagine that you’re on an on-call rotation which wakes you up whenever a systems memory reaches 100%. How do you respond to this? How do you identify what (if anything) is affected and to what degree they are affected?
Symptoms are manifestations of causes. Symptoms are invariants of the system. A symptom based alert is a high fidelity signal that something is anomalous because an invariant has been violated. Symptoms should be things that are actively being experienced by the system or end users such as:
- Error rates - Executions are encountering anomalous error rates.
- Latency Distributions - Requests are encountering anomalous latencies.
- Request / Execution Count Success Ratio - The system is not performing work or erroring on doing work.
- Queue depth - The system is unable to keep up with requested work.
Causes may indicate an issue. Symptoms do indicate an issue.
To illustrate this consider the following example:
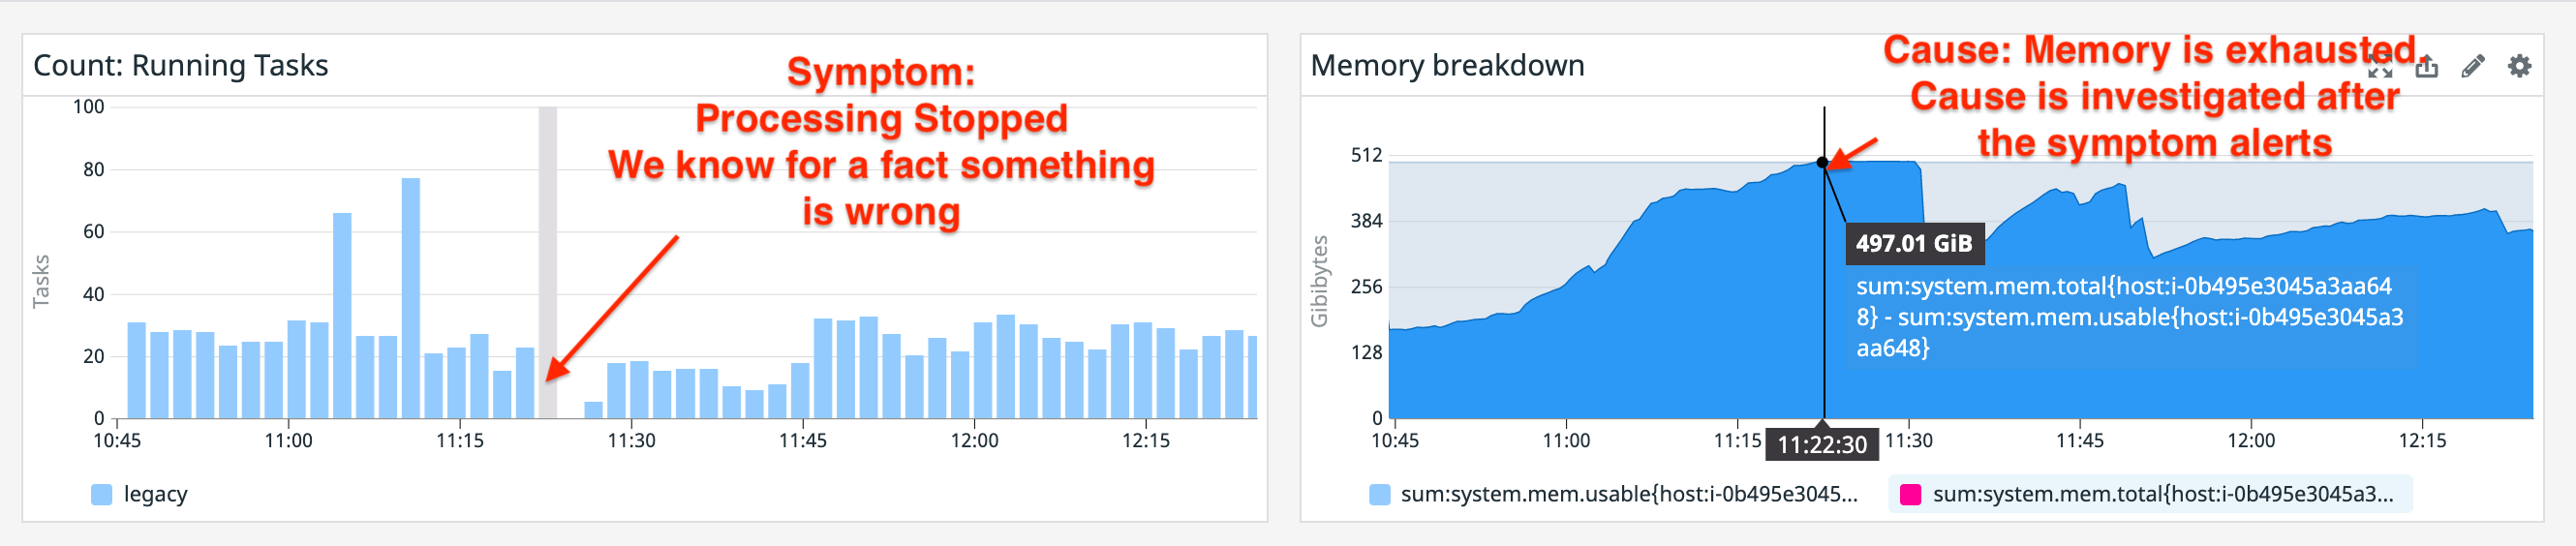
The symptom is the count of running tasks. We know there is a system invariant where there should always be > 0 running tasks. When an alert fires indicating there are 0 running tasks we know that we’ve violated an invariant and that intervention is required. On the right is the cause: memory is exhausted and the system started to swap hard and finally ground to a halt.
High system resource utilization (causes) is often important to know about but often makes for flaky and non-actionable high priority, wake a human up alerts. I find that it is helpful to have caused based alerts at a LOW/Notification level, to make sure they have some visibility and that humans know about them during work hours. If causes turn into critical issues the symptom based alerts should fire.
One of our most important alerts are “freshness” checks. These execute hourly and will select the most recent record and submit the difference between the current time and the record. This provides a metric which indicates how out of date a given table is. Each table has a defined threshold for staleness. Most tables can tolerate up to 24 hours (< 24 hours since last record) of stale data. This means when a freshness alert fires (> 24 hours) we know that a system invariant has been violated and we must respond.
The image below shows this in action:
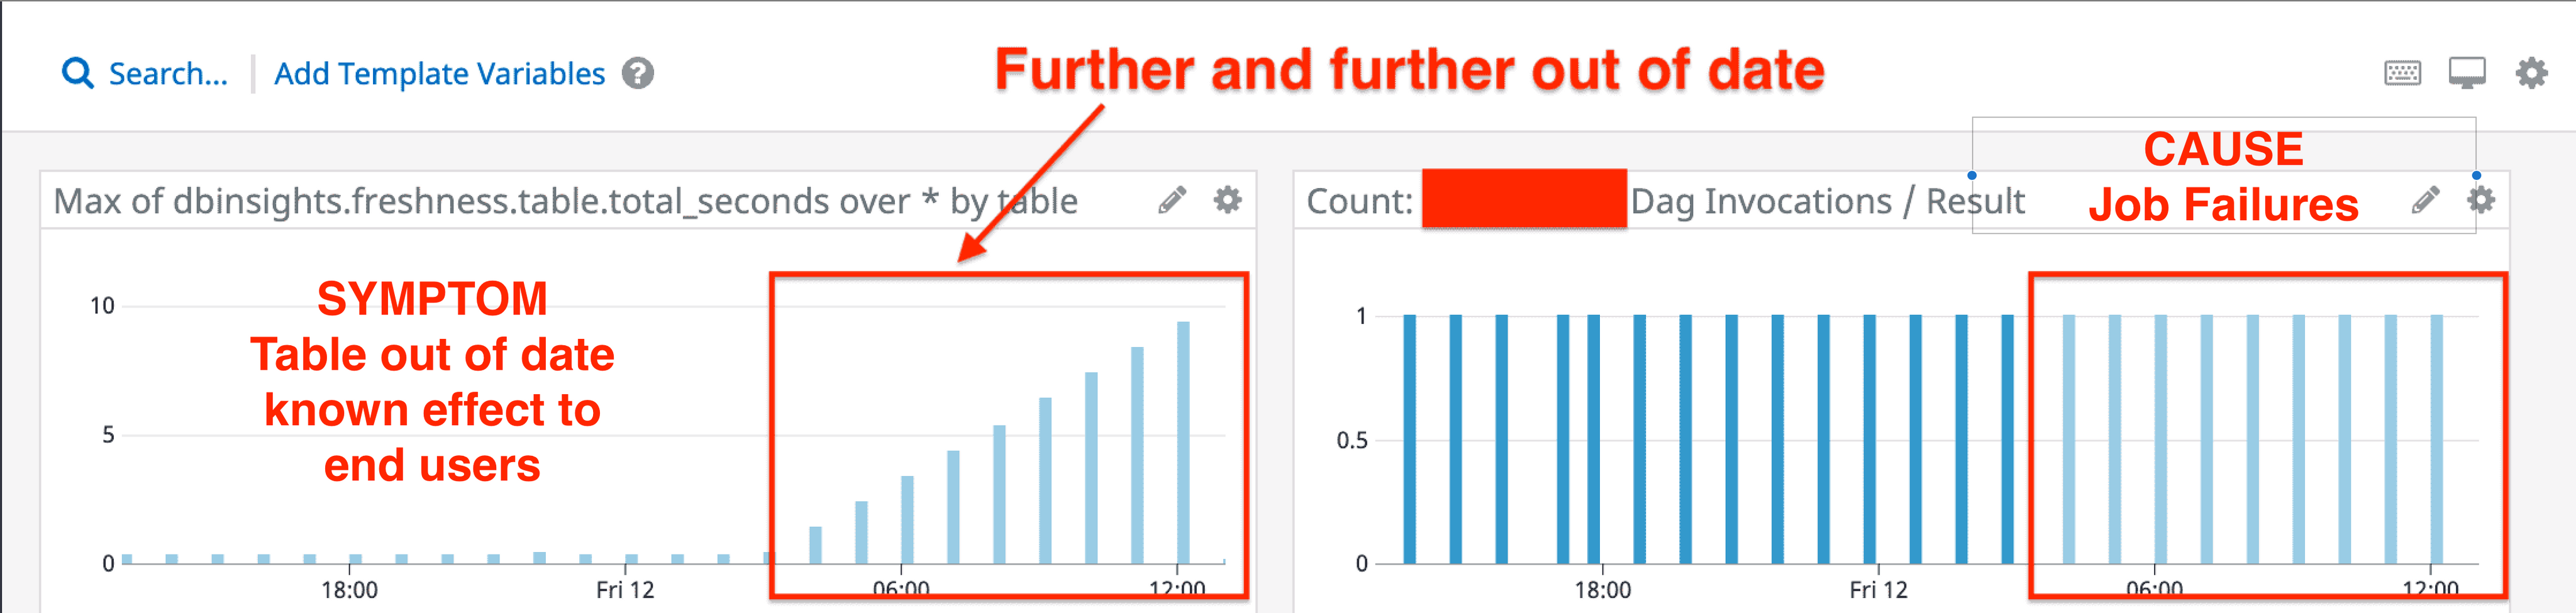
Our pagerduty level alerts are tied to the freshness checks, since if a table goes out of date we know for a fact that the system is in a bad state. Contrast this with errors. The system can error due to transient issues. If we connect errors to pagerduty alerts a human could wake up only to find that the system retried successfully, or the next run was successful. It’s important to track and be notified of errors but alerting on them, in this case, can lead to false positives.
Ratios Rule - But Be Careful
Ratios are a way to compare two values and are foundational for expressing the relationship between two values. Ratios are a building block for Service Level Objective based alerts and provide context to two individual metrics by showing how they compare to each other. Availability is one of the most common ratios in system monitoring and alerting, and is expressed as:

The reason I’m mentioning ratios is because they are foundational for the remaining strategies discussed in this blog post.
The following shows a concrete example of an availability ratio for a service:
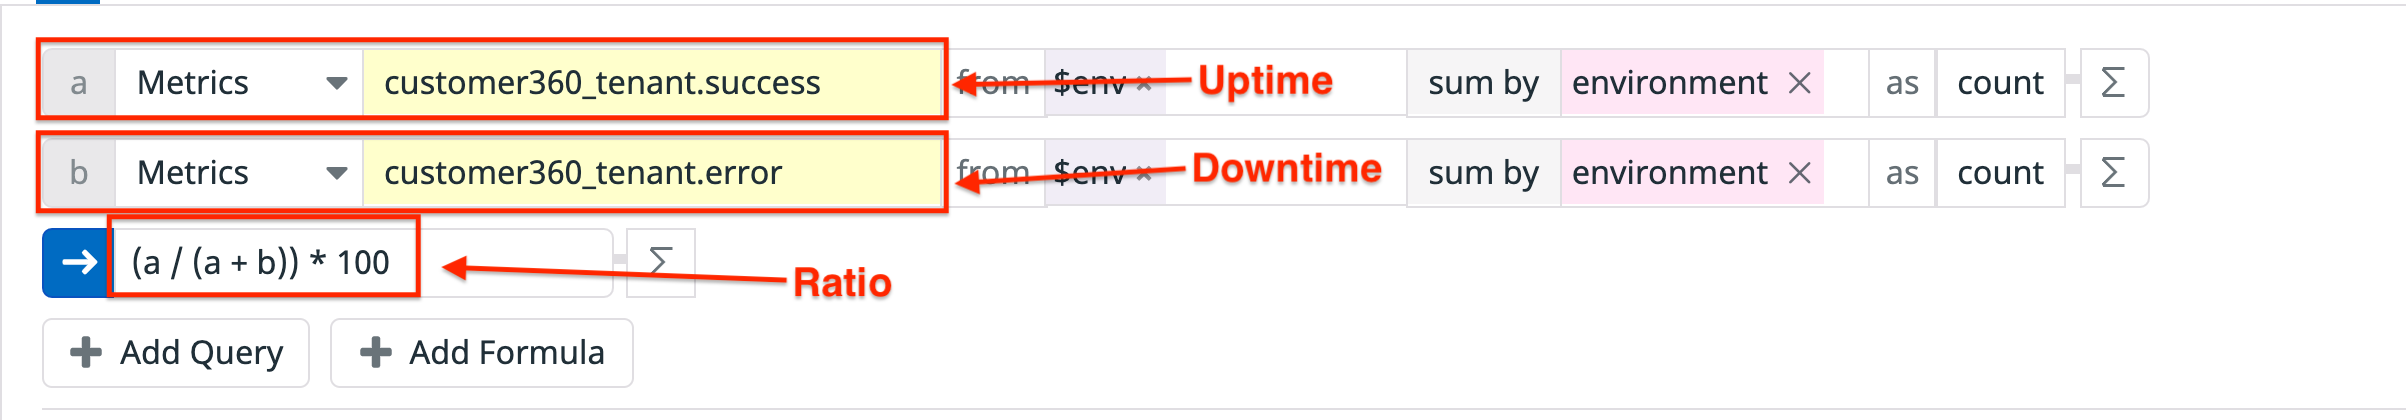
Graphing a ratio as a timeseries results in a single timeseries line:
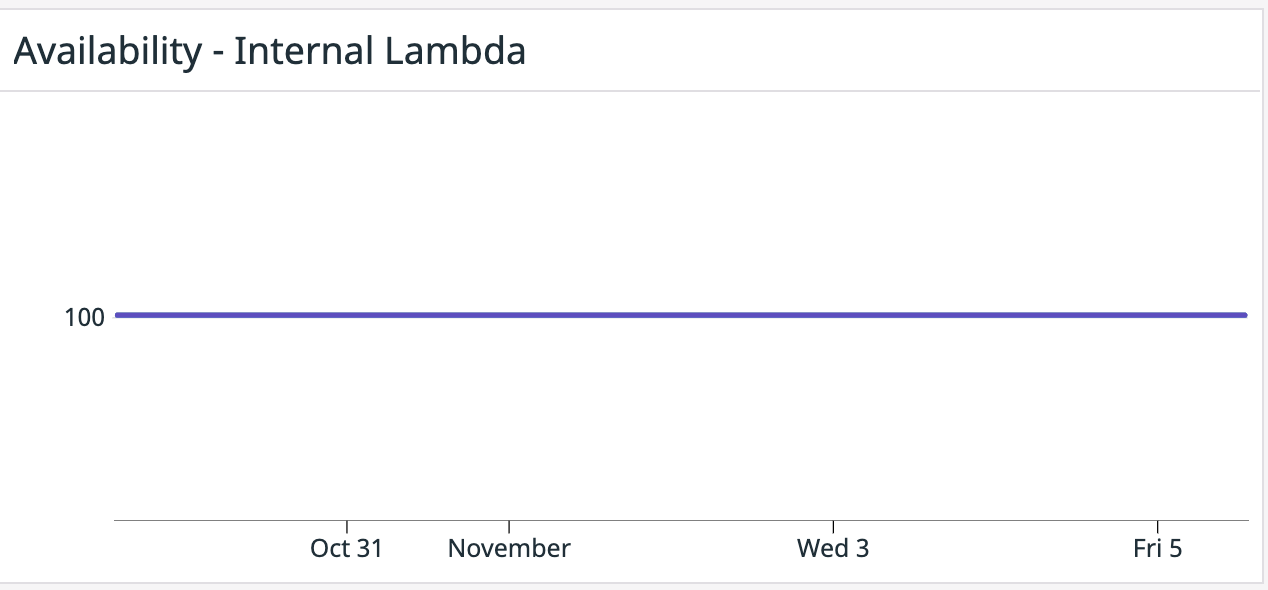
When no errors are present, this is a boring flat line. The timeseries looks much more interesting :p when issues occur:
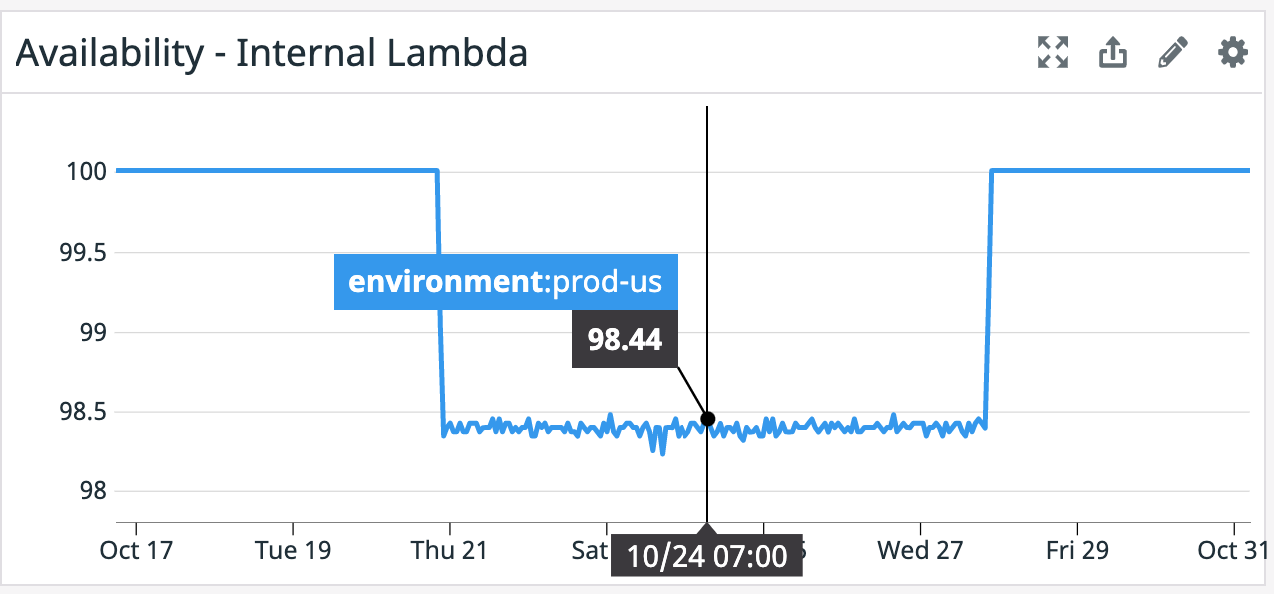
During this time period only 98.5% of transactions were completing successfully, this means that 1.5% of transactions were erroring out.
When using ratios it’s helpful to understand the denominator. For example if a job is executed 2 times a day and there is a single failure the availability is 50% for that given day, and there was a single impacted transaction. If a service handles 10,000 transactions per second with a 50% error ratio, that means 5,000 transactions were impacted!!
Emulate The Customer Experience: Probes Probes Probes Probes Probes :infinity:
I’ve found emulating the customer experience through probes to be one of the most powerful monitoring techniques available. Probes have 2 important components:
- Make requests to the system in the same manner any other client would (i.e. HTTP request to an HTTP server, SQL requests, etc.
- Emit a metric of the result success|failure
Probes can answer: Can a known controlled client interact with the system?
Pagerduty is tied to a number of critical probes:
- Redshift: Every minute a probe connect to a redshift cluster and ensure we can execute a SQL query.
- Airflow: Every minute a probe invokes a job on airflow and ensures that it completes successfully.
- Freshness: Every hour we check the latest record in our critical database tables (MAX(created_at)) and ensure that it is within some threshold (~24 hours).
Probes are a great way of testing invariants from a clients perspective. If a probe is unable to connect to redshift, it is highly indicative of a global error. If freshness gets out of date, we know that clients are impacted. Probes test symptoms:
| Symptom | Invariant |
|---|---|
| Tables are out of date. | Tables must have a record that is no more than x hours out of date. |
| Client is unable to execute queries against the database. | Client must be able to successfully execute queries every x interval. |
| Airflow is unable to schedule jobs. | Airflow must be able to successfully schedule a job per minute. |
When probe alerts fire we know for a fact that an invariant has been violated, and a human should begin to debug.
Give Yourself Room to Fail - SLO Based Alerts
The final technique that was critical to keeping on call load low was providing a failure buffer. This is called an error budget. Error budgets allow some percentage of failures and still consider the system healthy. When an error budget is exhausted a system invariant has been violated and we know for a fact that a human is required to intervene.
Datadog supports SLO based alerts natively. SLO based alerts contain 2 components:
- A success ratio (successful events / total events)
- A target expressed as a percentage (the percentage of successful events required in an interval to be considered health)
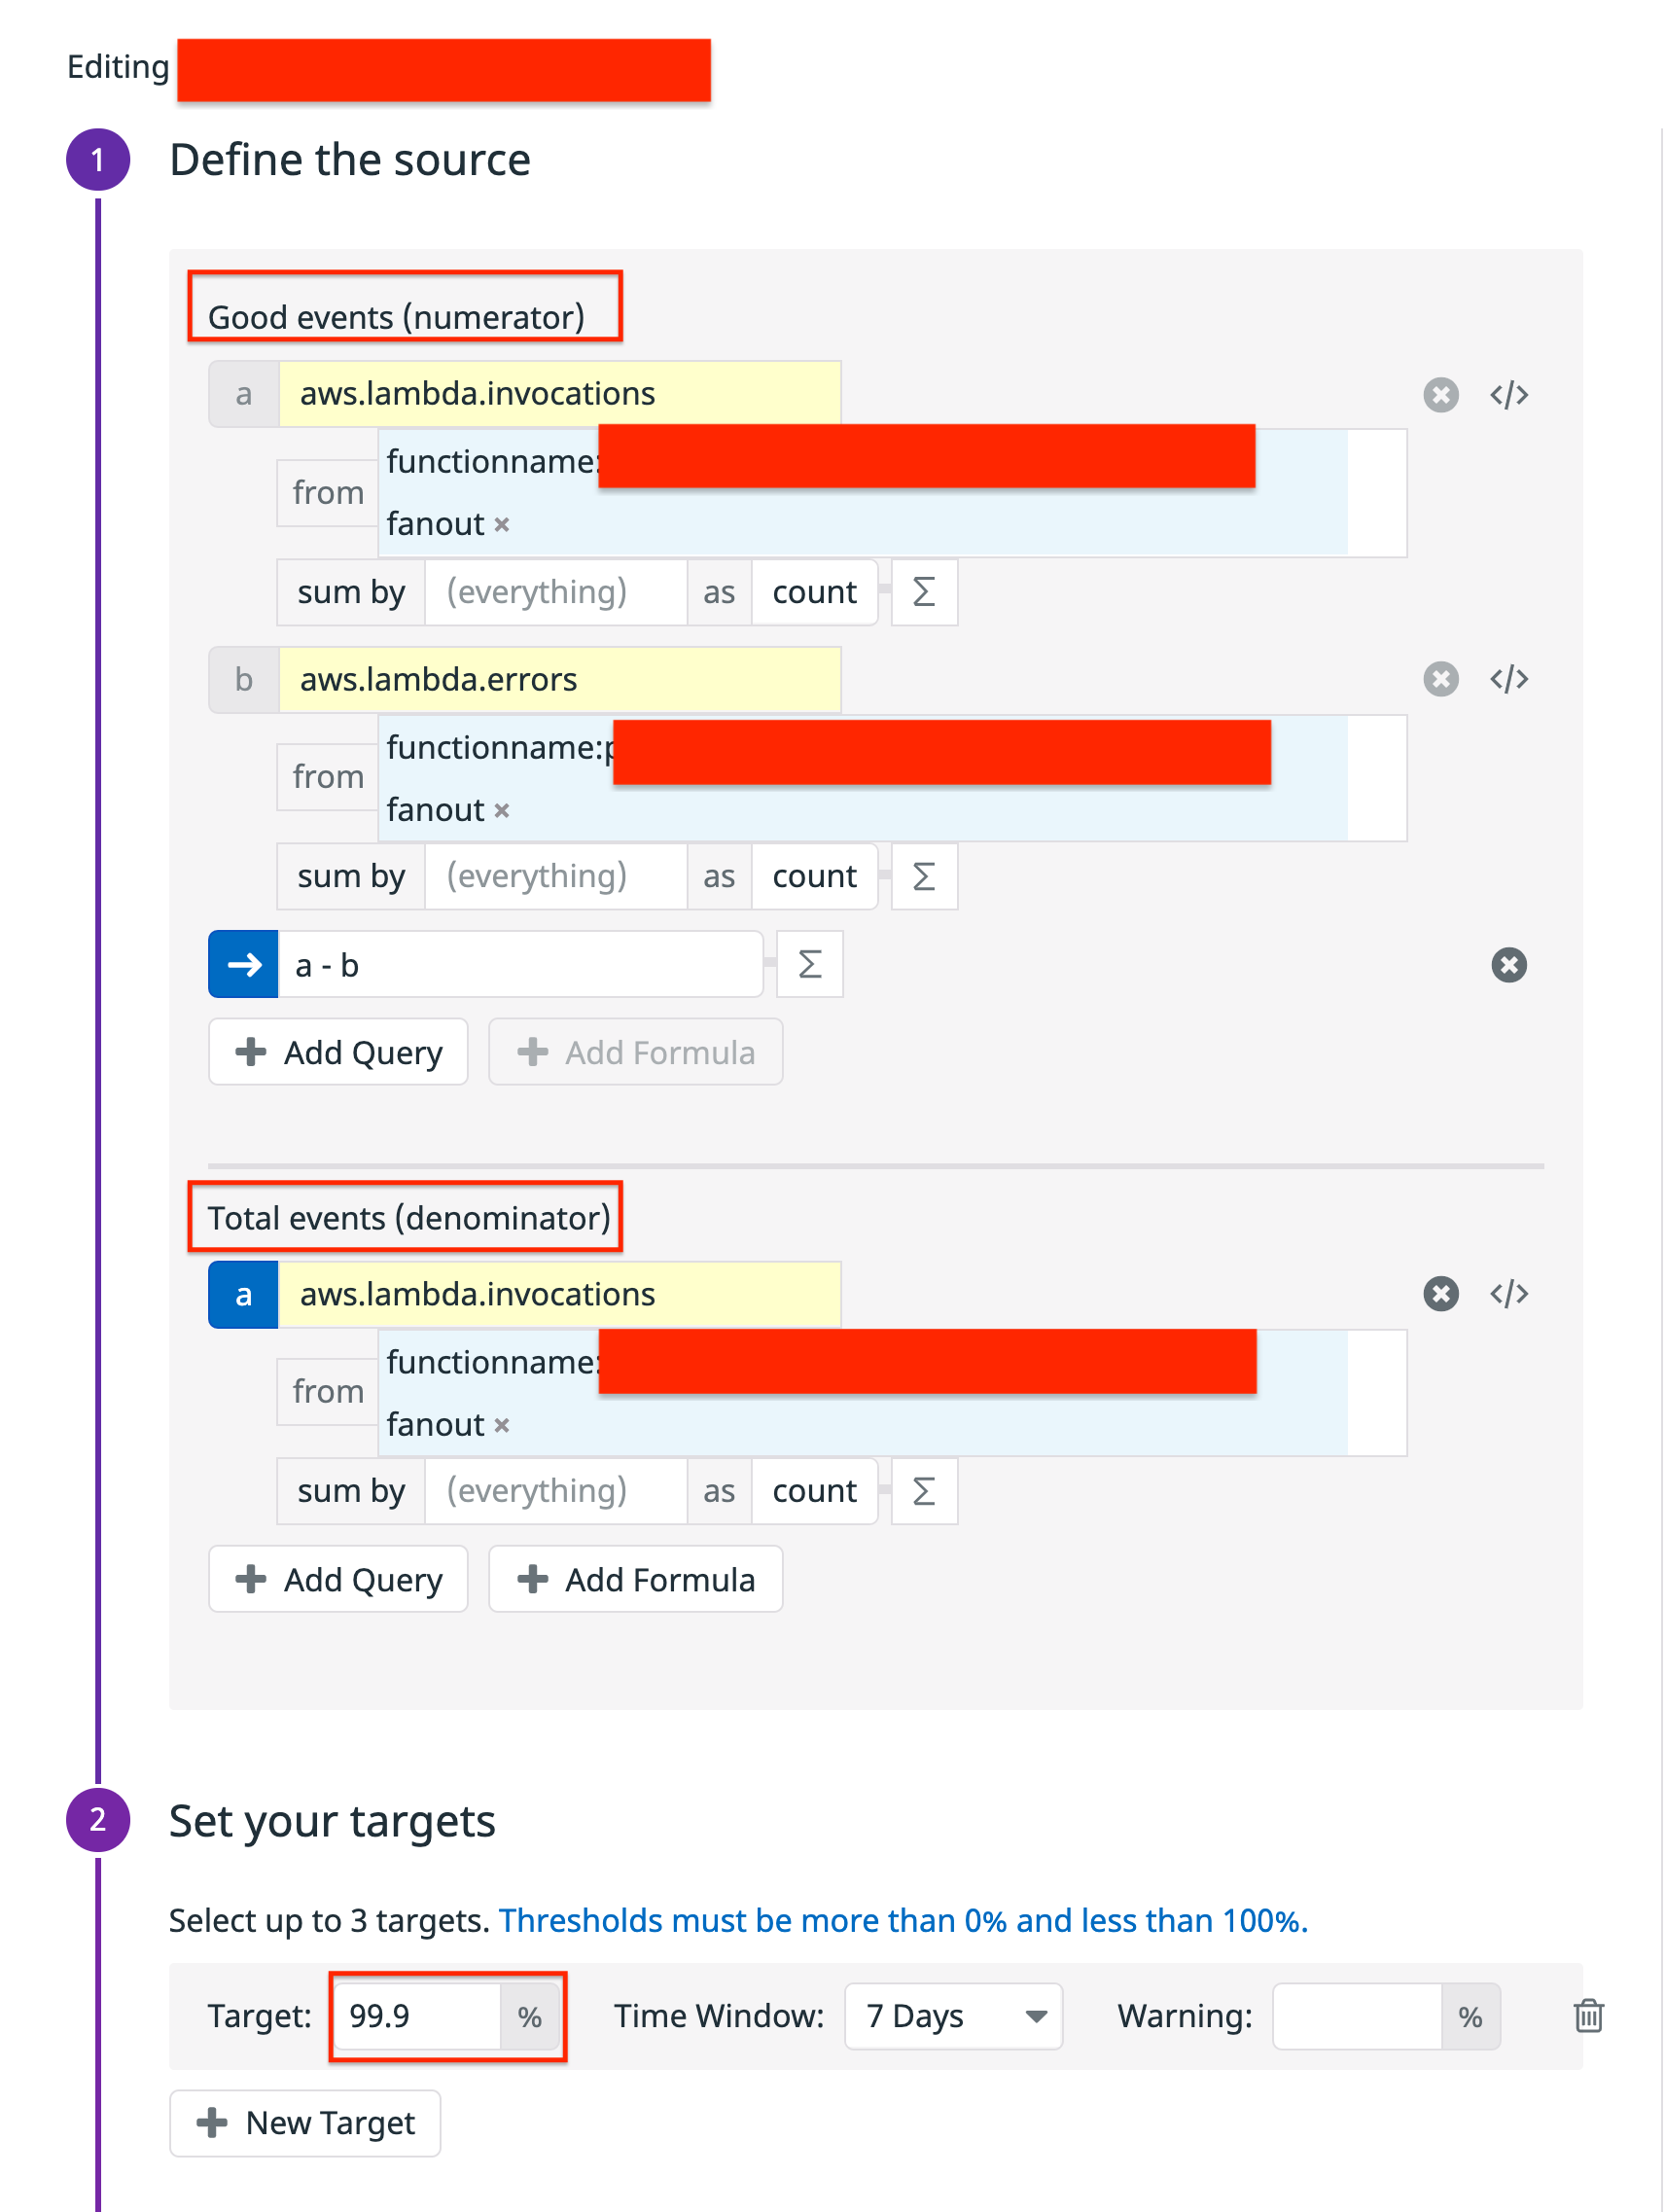
The following shows an example of the tenant log lambda, which defines an slo target of 99.9%. This means it tolerates 1 failure every 1000 invocations. When the error budget is exhausted a pagerduty alert fires. Since the error budget represents a system invariant, we know that the system is in an unhealthy state and that human intervention is required.
The following shows a historical view of the budget over 7 days:
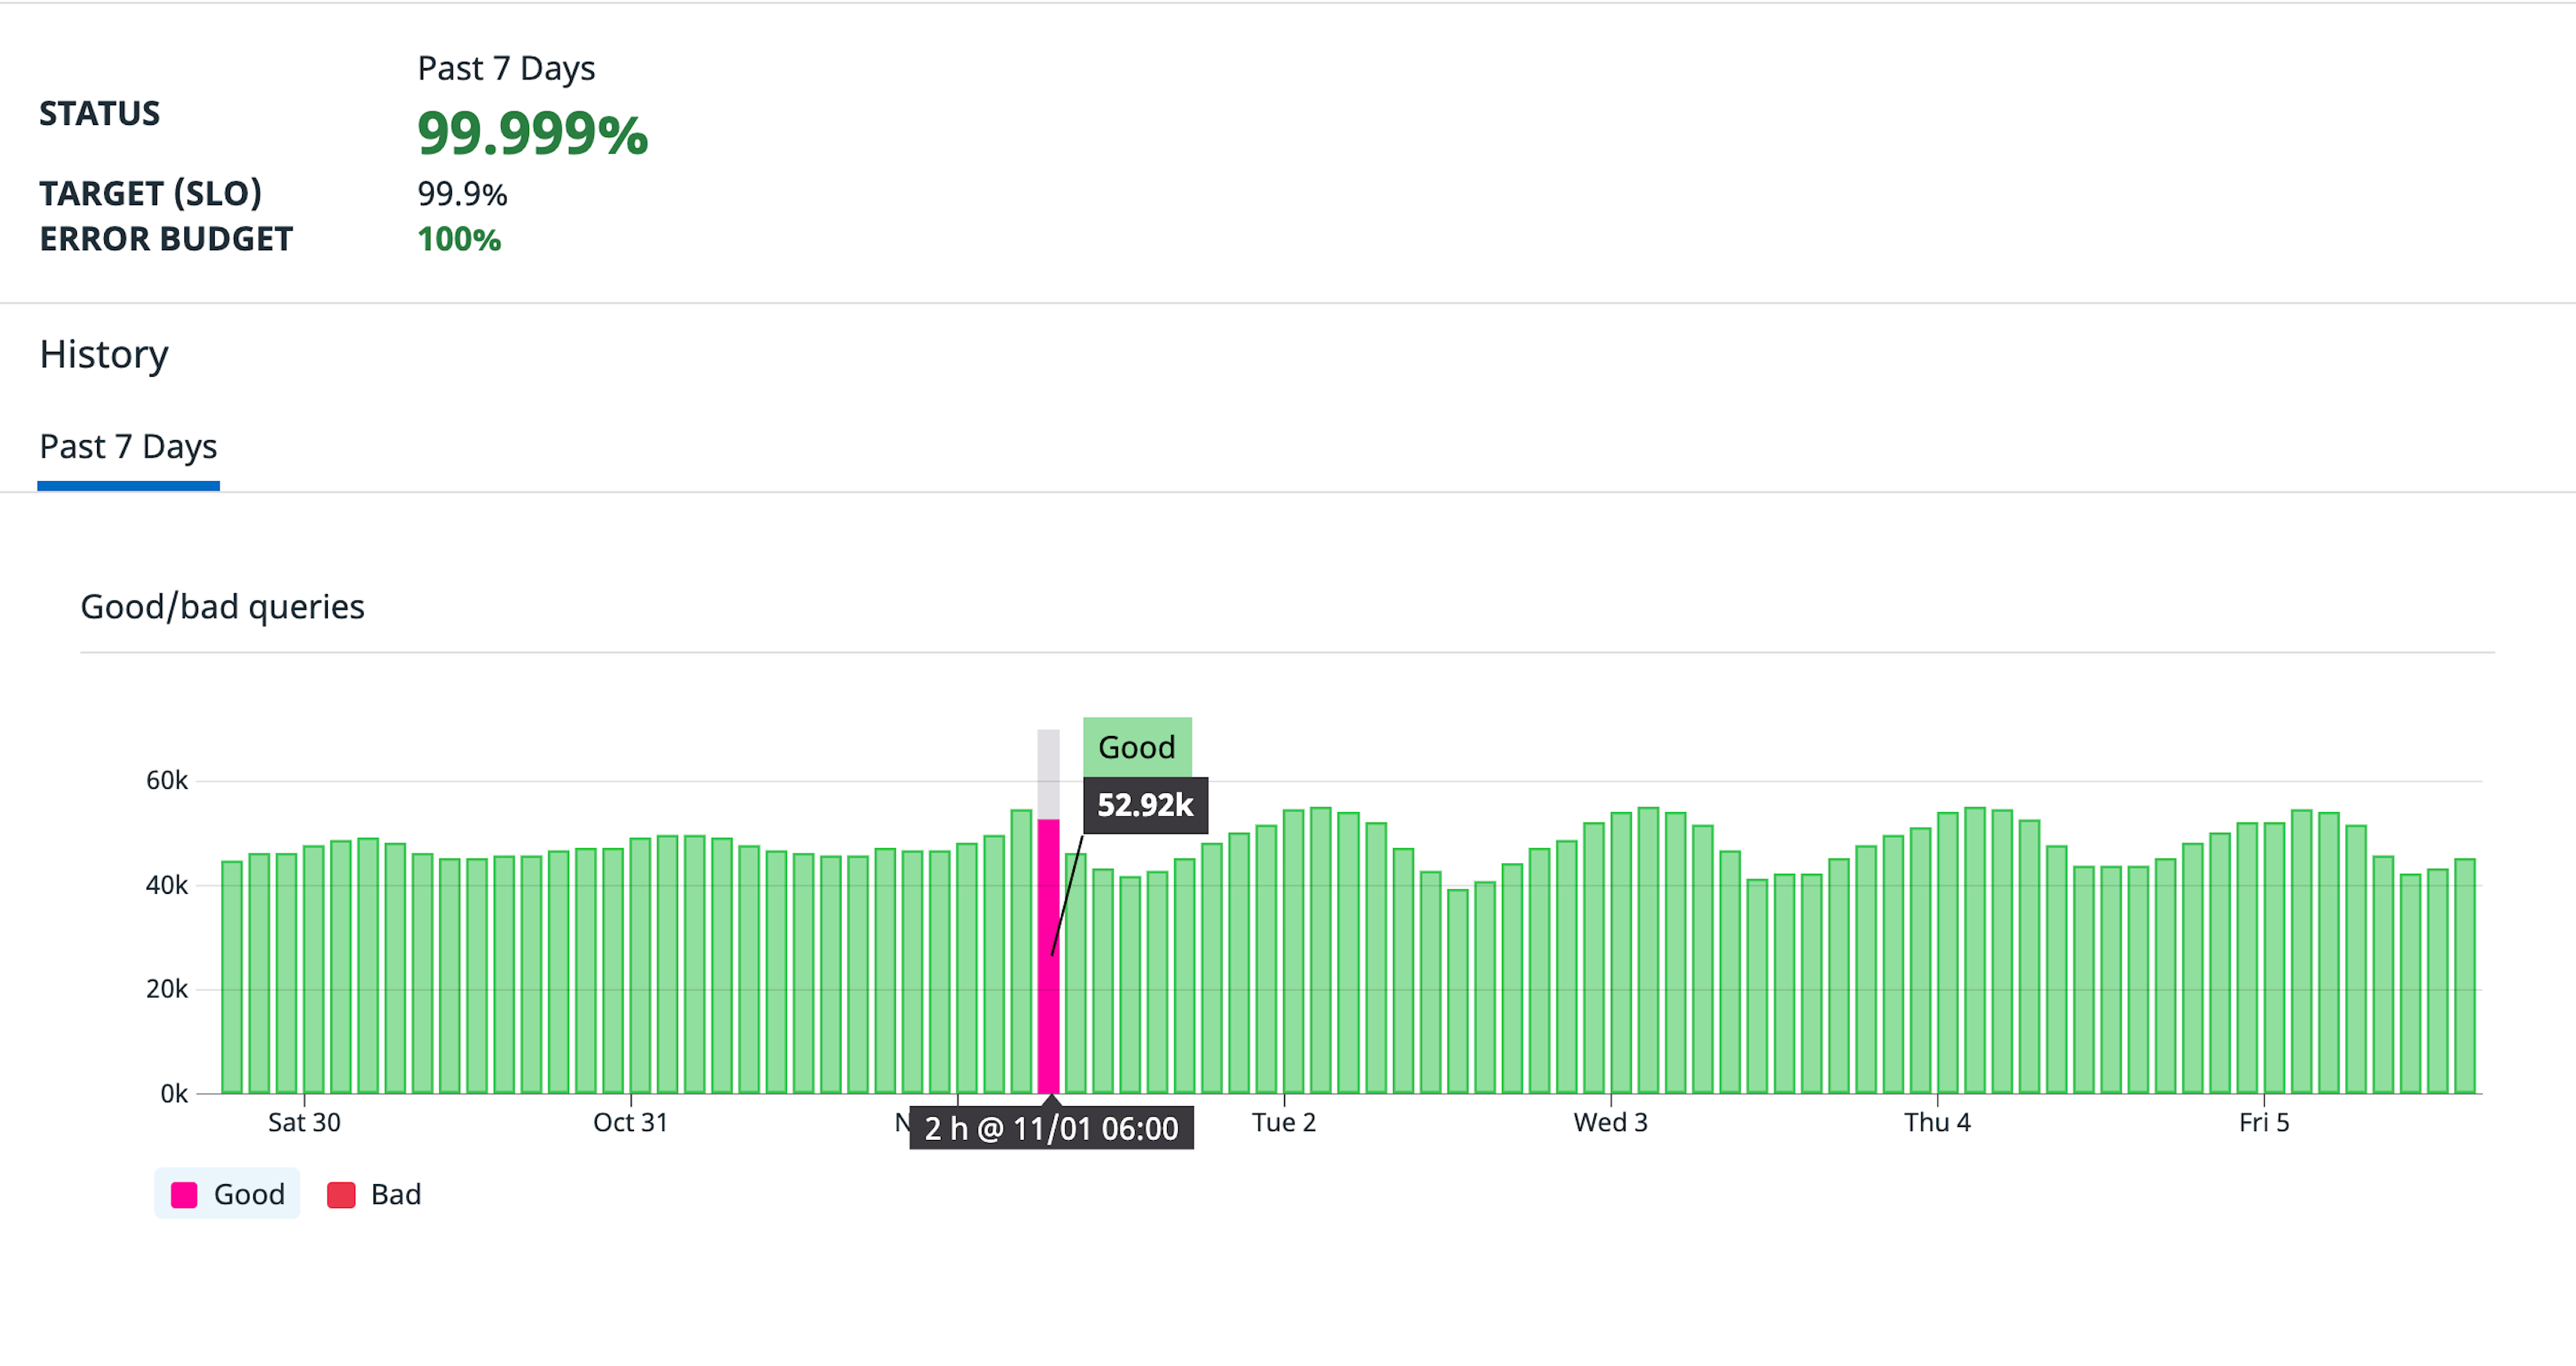
In the past 7 days we’ve achieved 5 9’s of availability. Notice it is not 100% because we recognize that the system can produce some percentage of errors and still be considered healthy; we Give Ourselves Room To Fail.
Conclusion
While I feel like i minimized alerting overhead there is no substitute for a full on call rotation and a team of people supporting each other. Looking back I wish I was a lot more aggressive with building out a full team on call rotation instead of filling in the gaps myself. Looking back on the alert history for this article I see the "Eventhub" service triggered the most alerts:
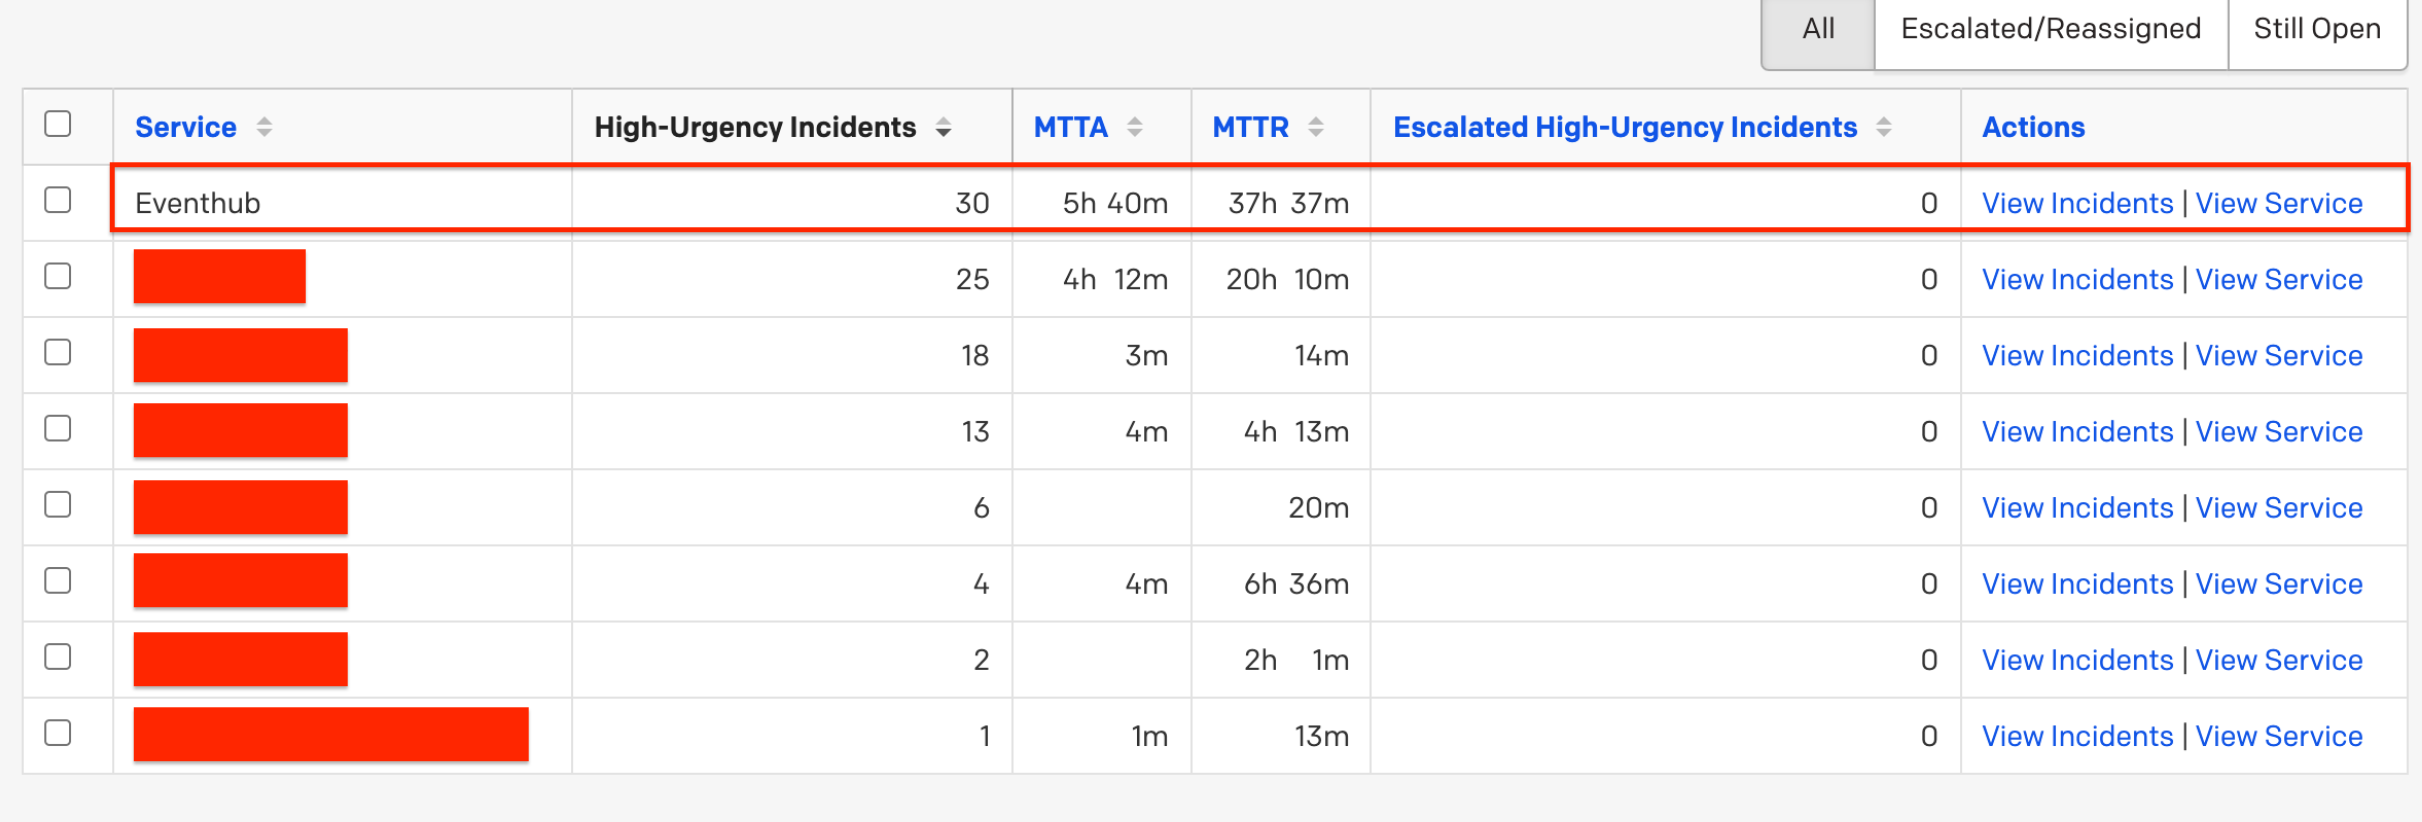
Eventhub triggered an infrequent but regular alert which required a re-run of the job. I wish I had taken the time to codify this retry logic using software which should have removed ~15 incidents (~16% of total incidents over the last 15 months).
Overall the experience was pretty pain free. There were a number of nights waking up to the pagerduty alarm in the middle of the night, but all in all the load was pretty minimal.