- Published on
AWS Lambda - Debugging File Descriptor Exhaustion Using Go
- Authors

- Name
- Danny Mican
TL;DR I hit the 1024 File descriptor limit in lambda. AWS has a bug handling this case, in which END and REPORT logs were omitted. The fixed required bounding File Descriptor usage by configuring the go http client (*http.Client).
Background
I recently worked on a project to extend application log retention and reduce costs. Part of the solution involved aggregating raw application log files from S3. These log files range in size from range from 100KB → ~1MB and numbered ~30,000 files for an hour. A go program was created to aggregate the raw log files into 32MB files. The program was deployed as an AWS lambda and executed hourly. The lambda takes a “raw” s3 directory as input, and downloads all files in that directory buffers them to 32MB, and writes them out to an output directory whenever files reach 32MB:
s3://application-logs/raw/.../YYYYmmdd/HH/
<- Lambda ->
s3://application-logs/aggregated/.../YYYYmmdd/HH/
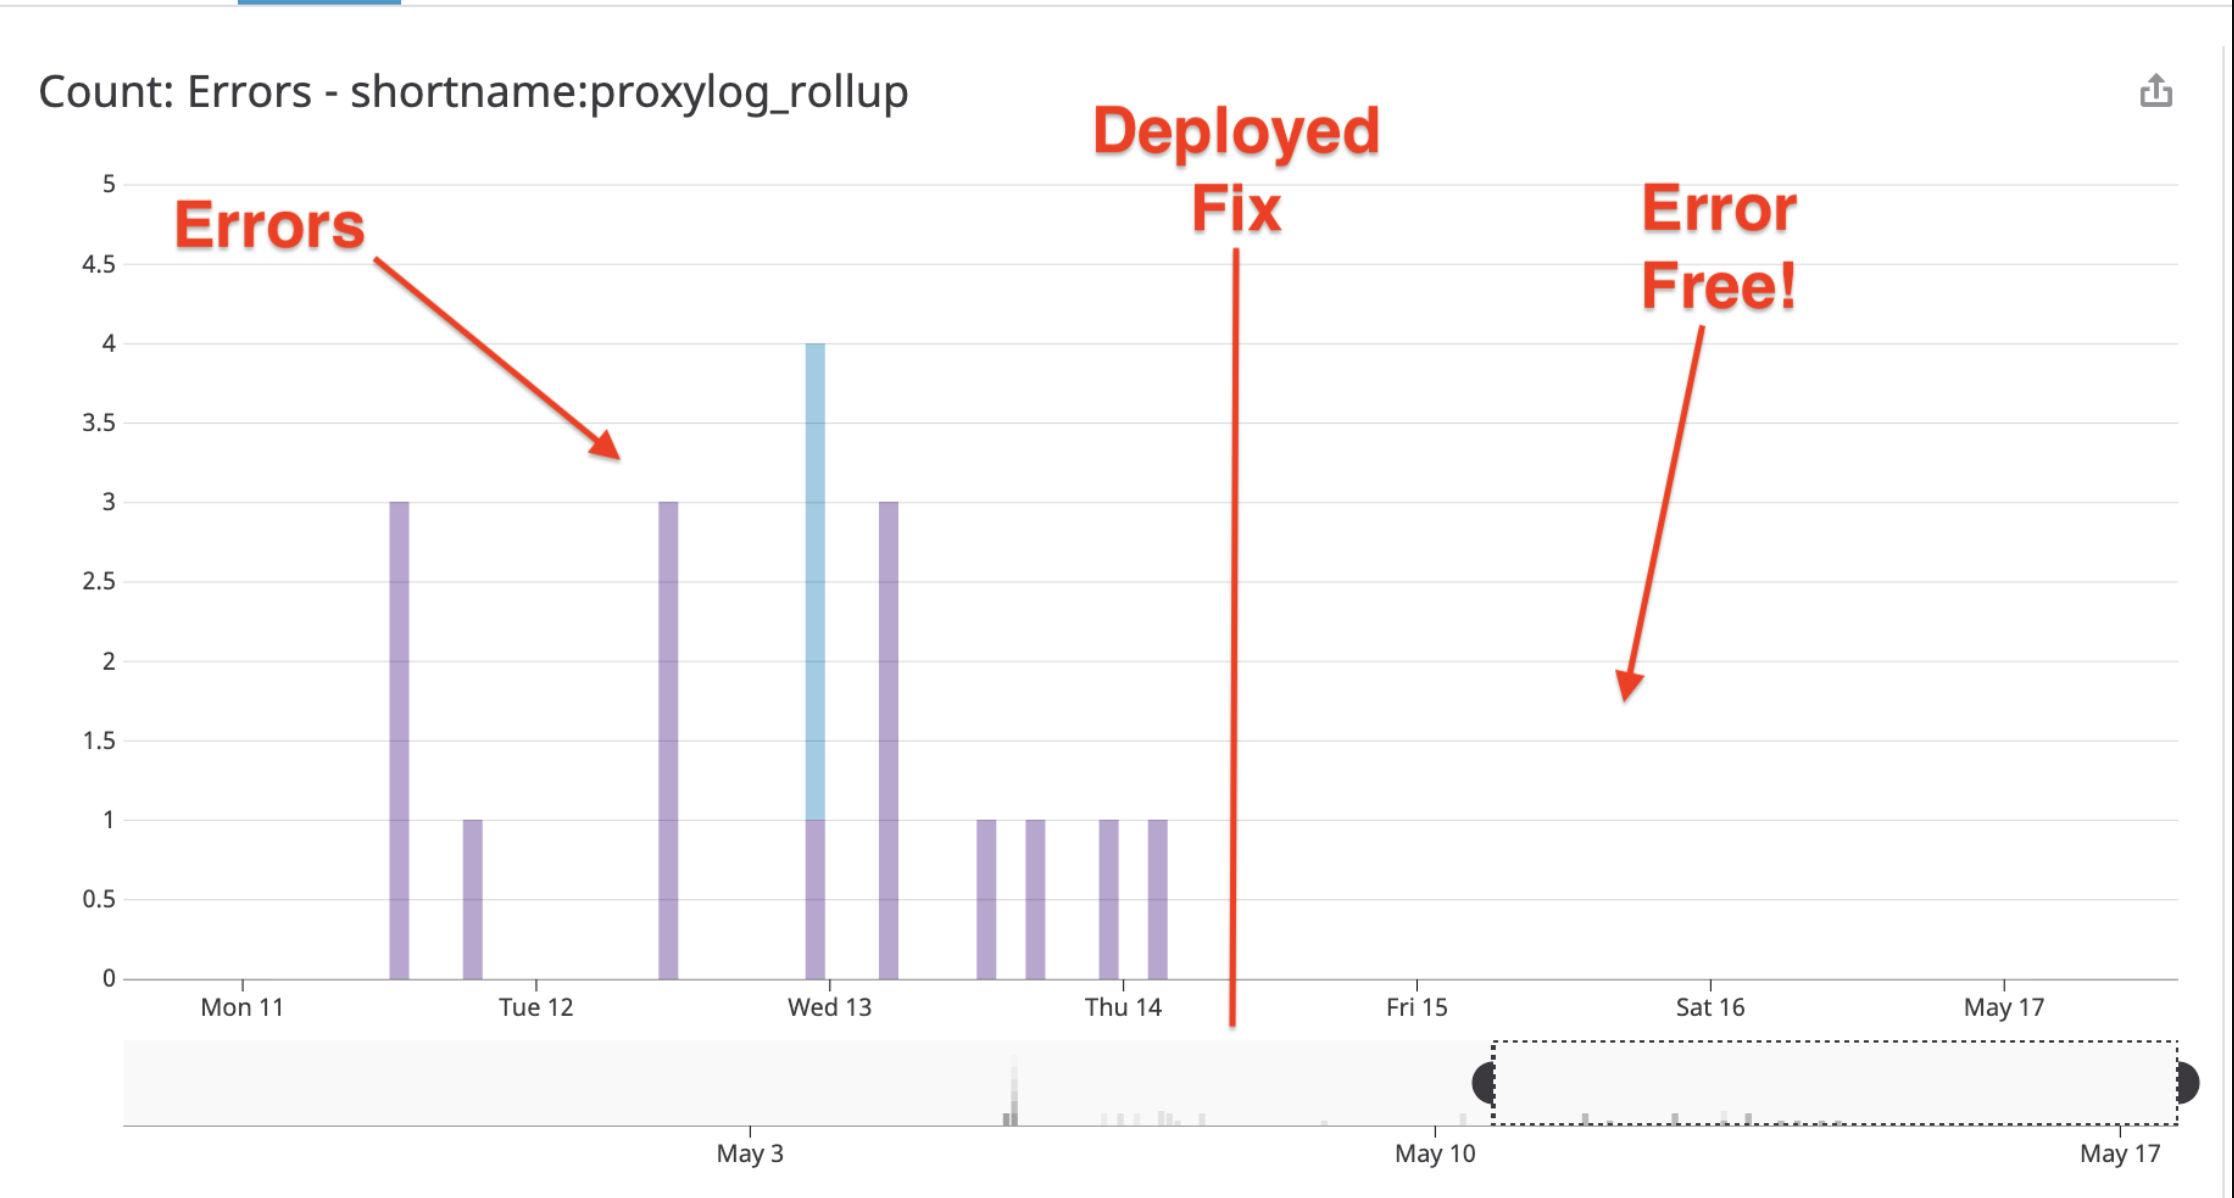
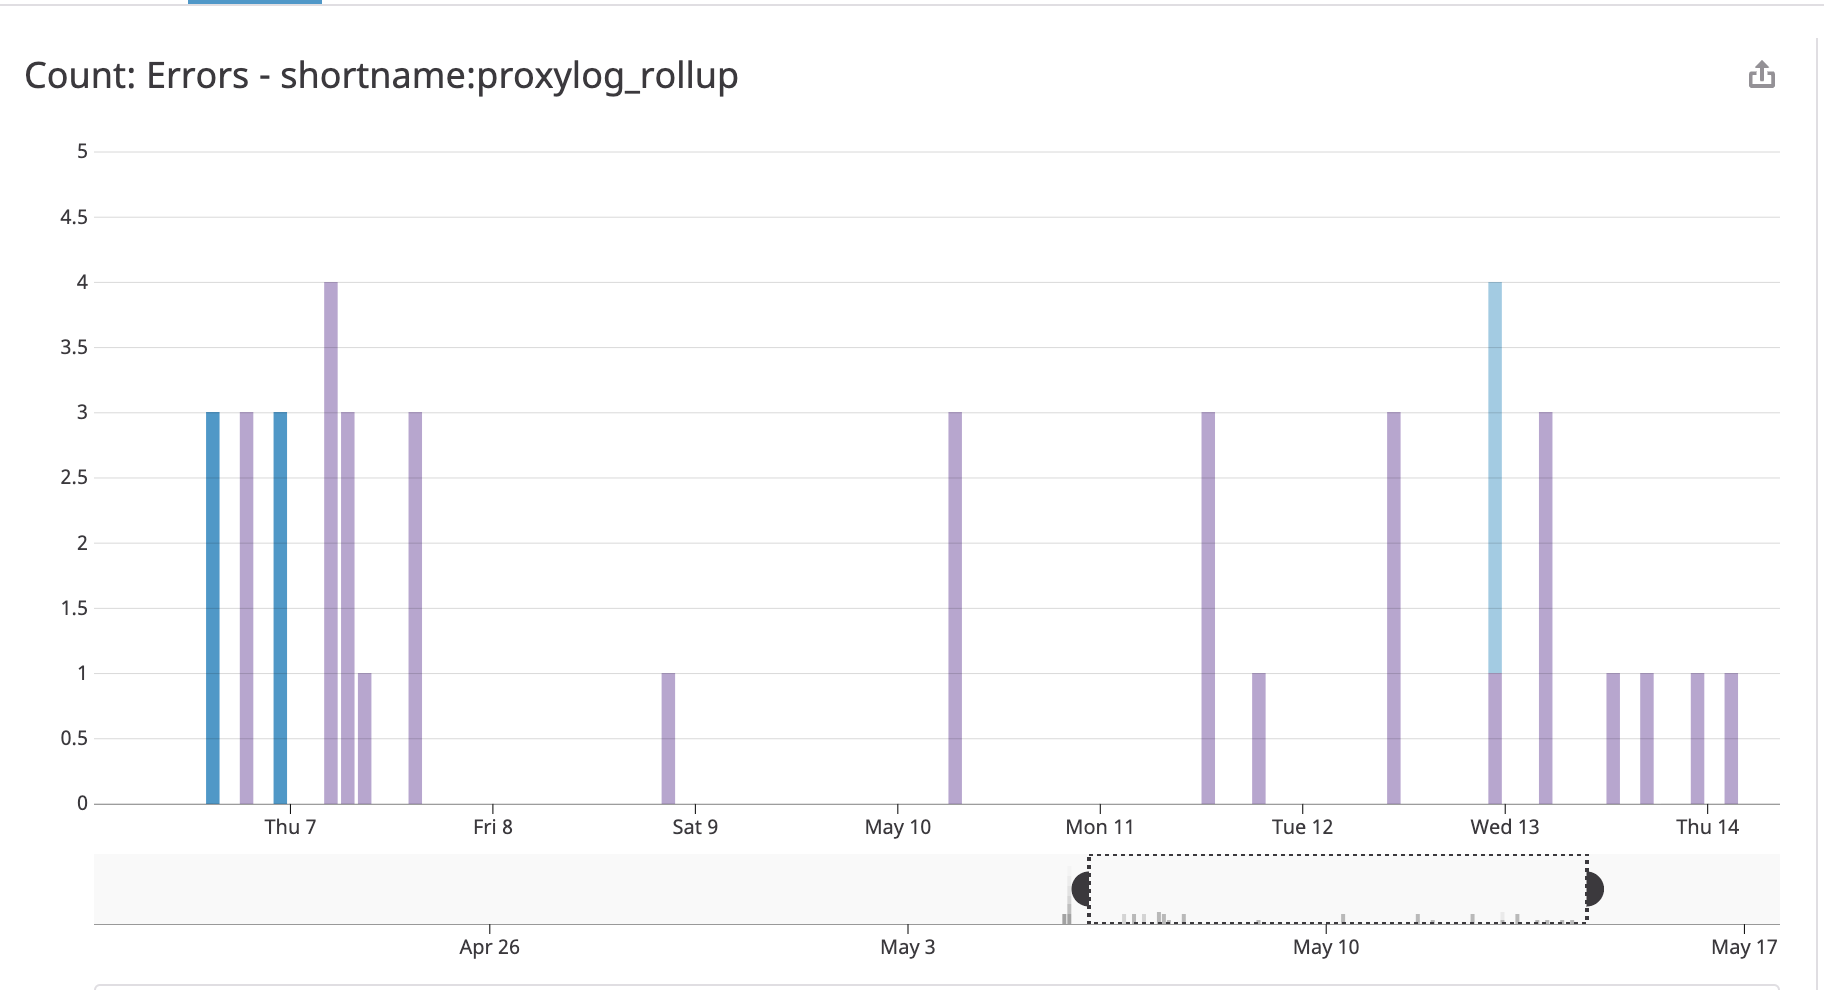
Regular errors occurred when the lambda was launched:
A Strange Occurrence
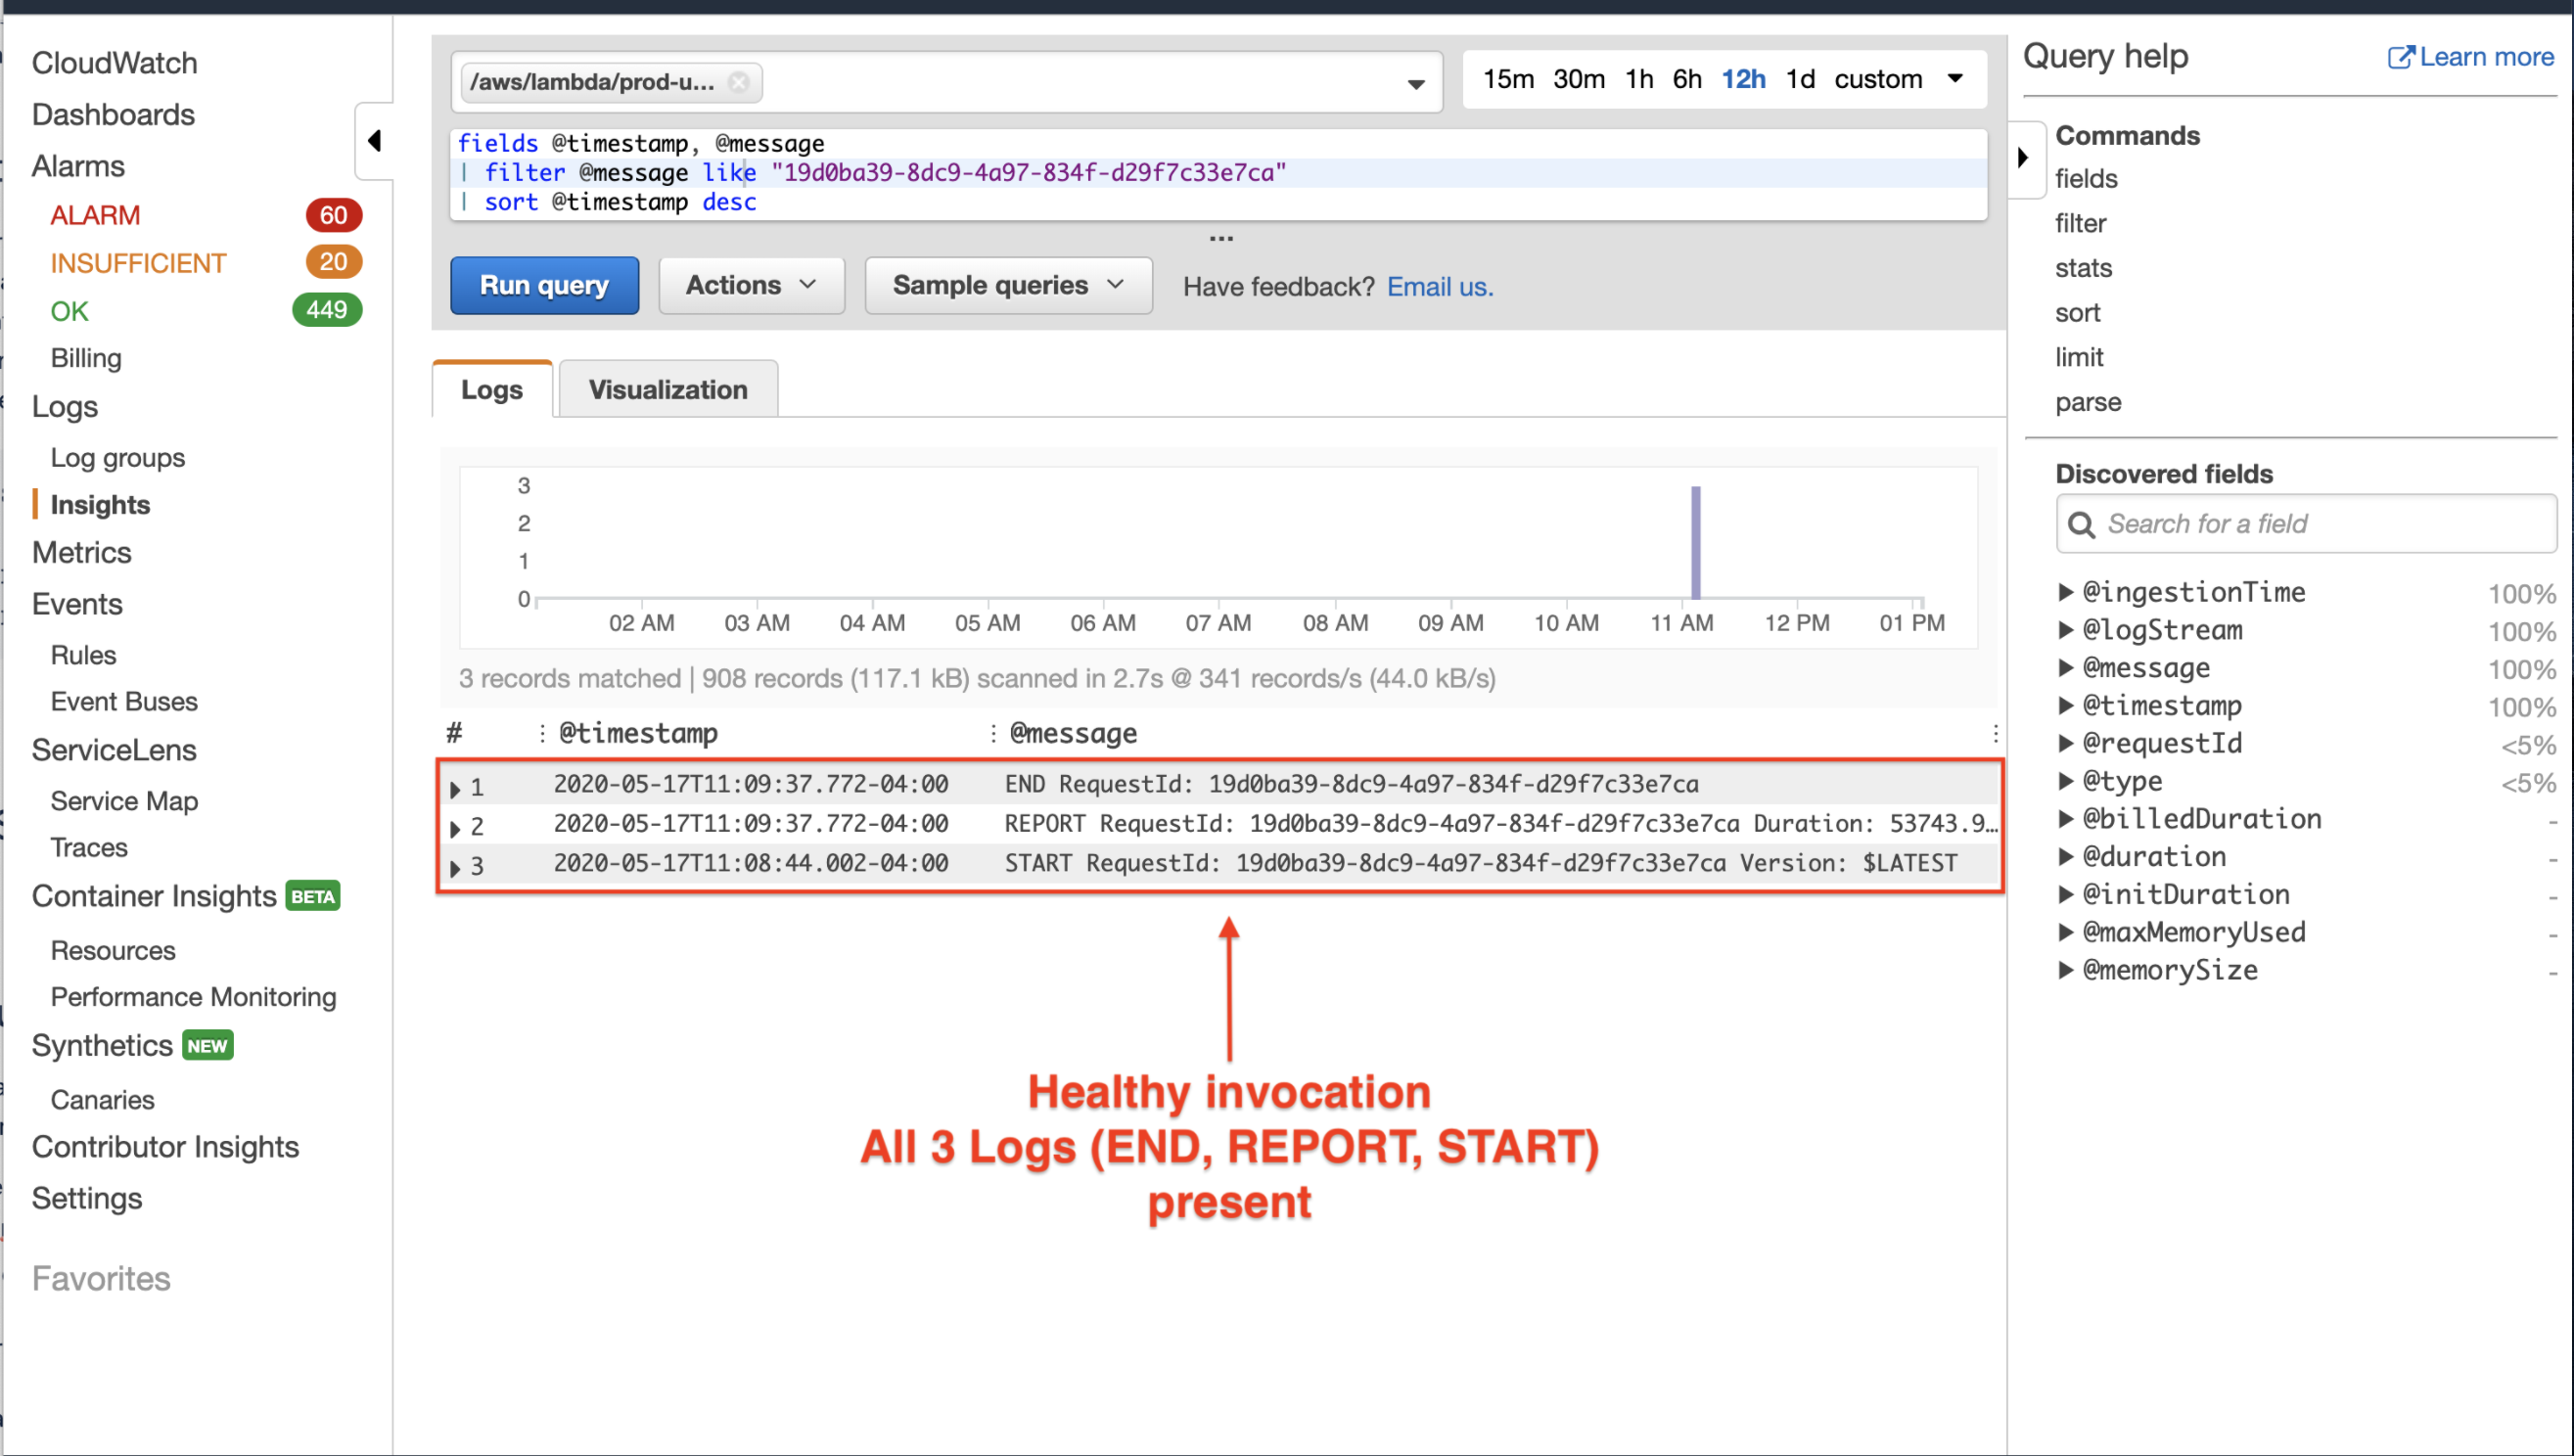
The first thing I did after seeing the failed invocations was to check the logs. A number of codepaths in the rollup script intentionally panics to trigger a lambda retry. Each lambda invocation is idempotent which simplifies the lambda code and allows for ignoring complicated error handling, state management, and edge cases. It was immediately obvious something strange was going on. Every healthy AWS Lambda invocation results in 3 log statements: START, END and REPORT which look like:
START RequestId: c793869b-ee49-115b-a5b6-4fd21e8dedac Version: $LATEST 2019-06-07T19:11:20.562Z	c793869b-ee49-115b-a5b6-4fd21e8dedac
...
END RequestId: c793869b-ee49-115b-a5b6-4fd21e8dedac
REPORT RequestId: c793869b-ee49-115b-a5b6-4fd21e8dedac	Duration: 128.83 ms	Billed Duration: 200 ms	Memory Size: 128 MB	Max Memory Used: 74 MB	Init Duration: 166.62 ms	XRAY TraceId: 1-5d9d007f-0a8c7fd02xmpl480aed55ef0	SegmentId: 3d752xmpl1bbe37e	Sampled: true
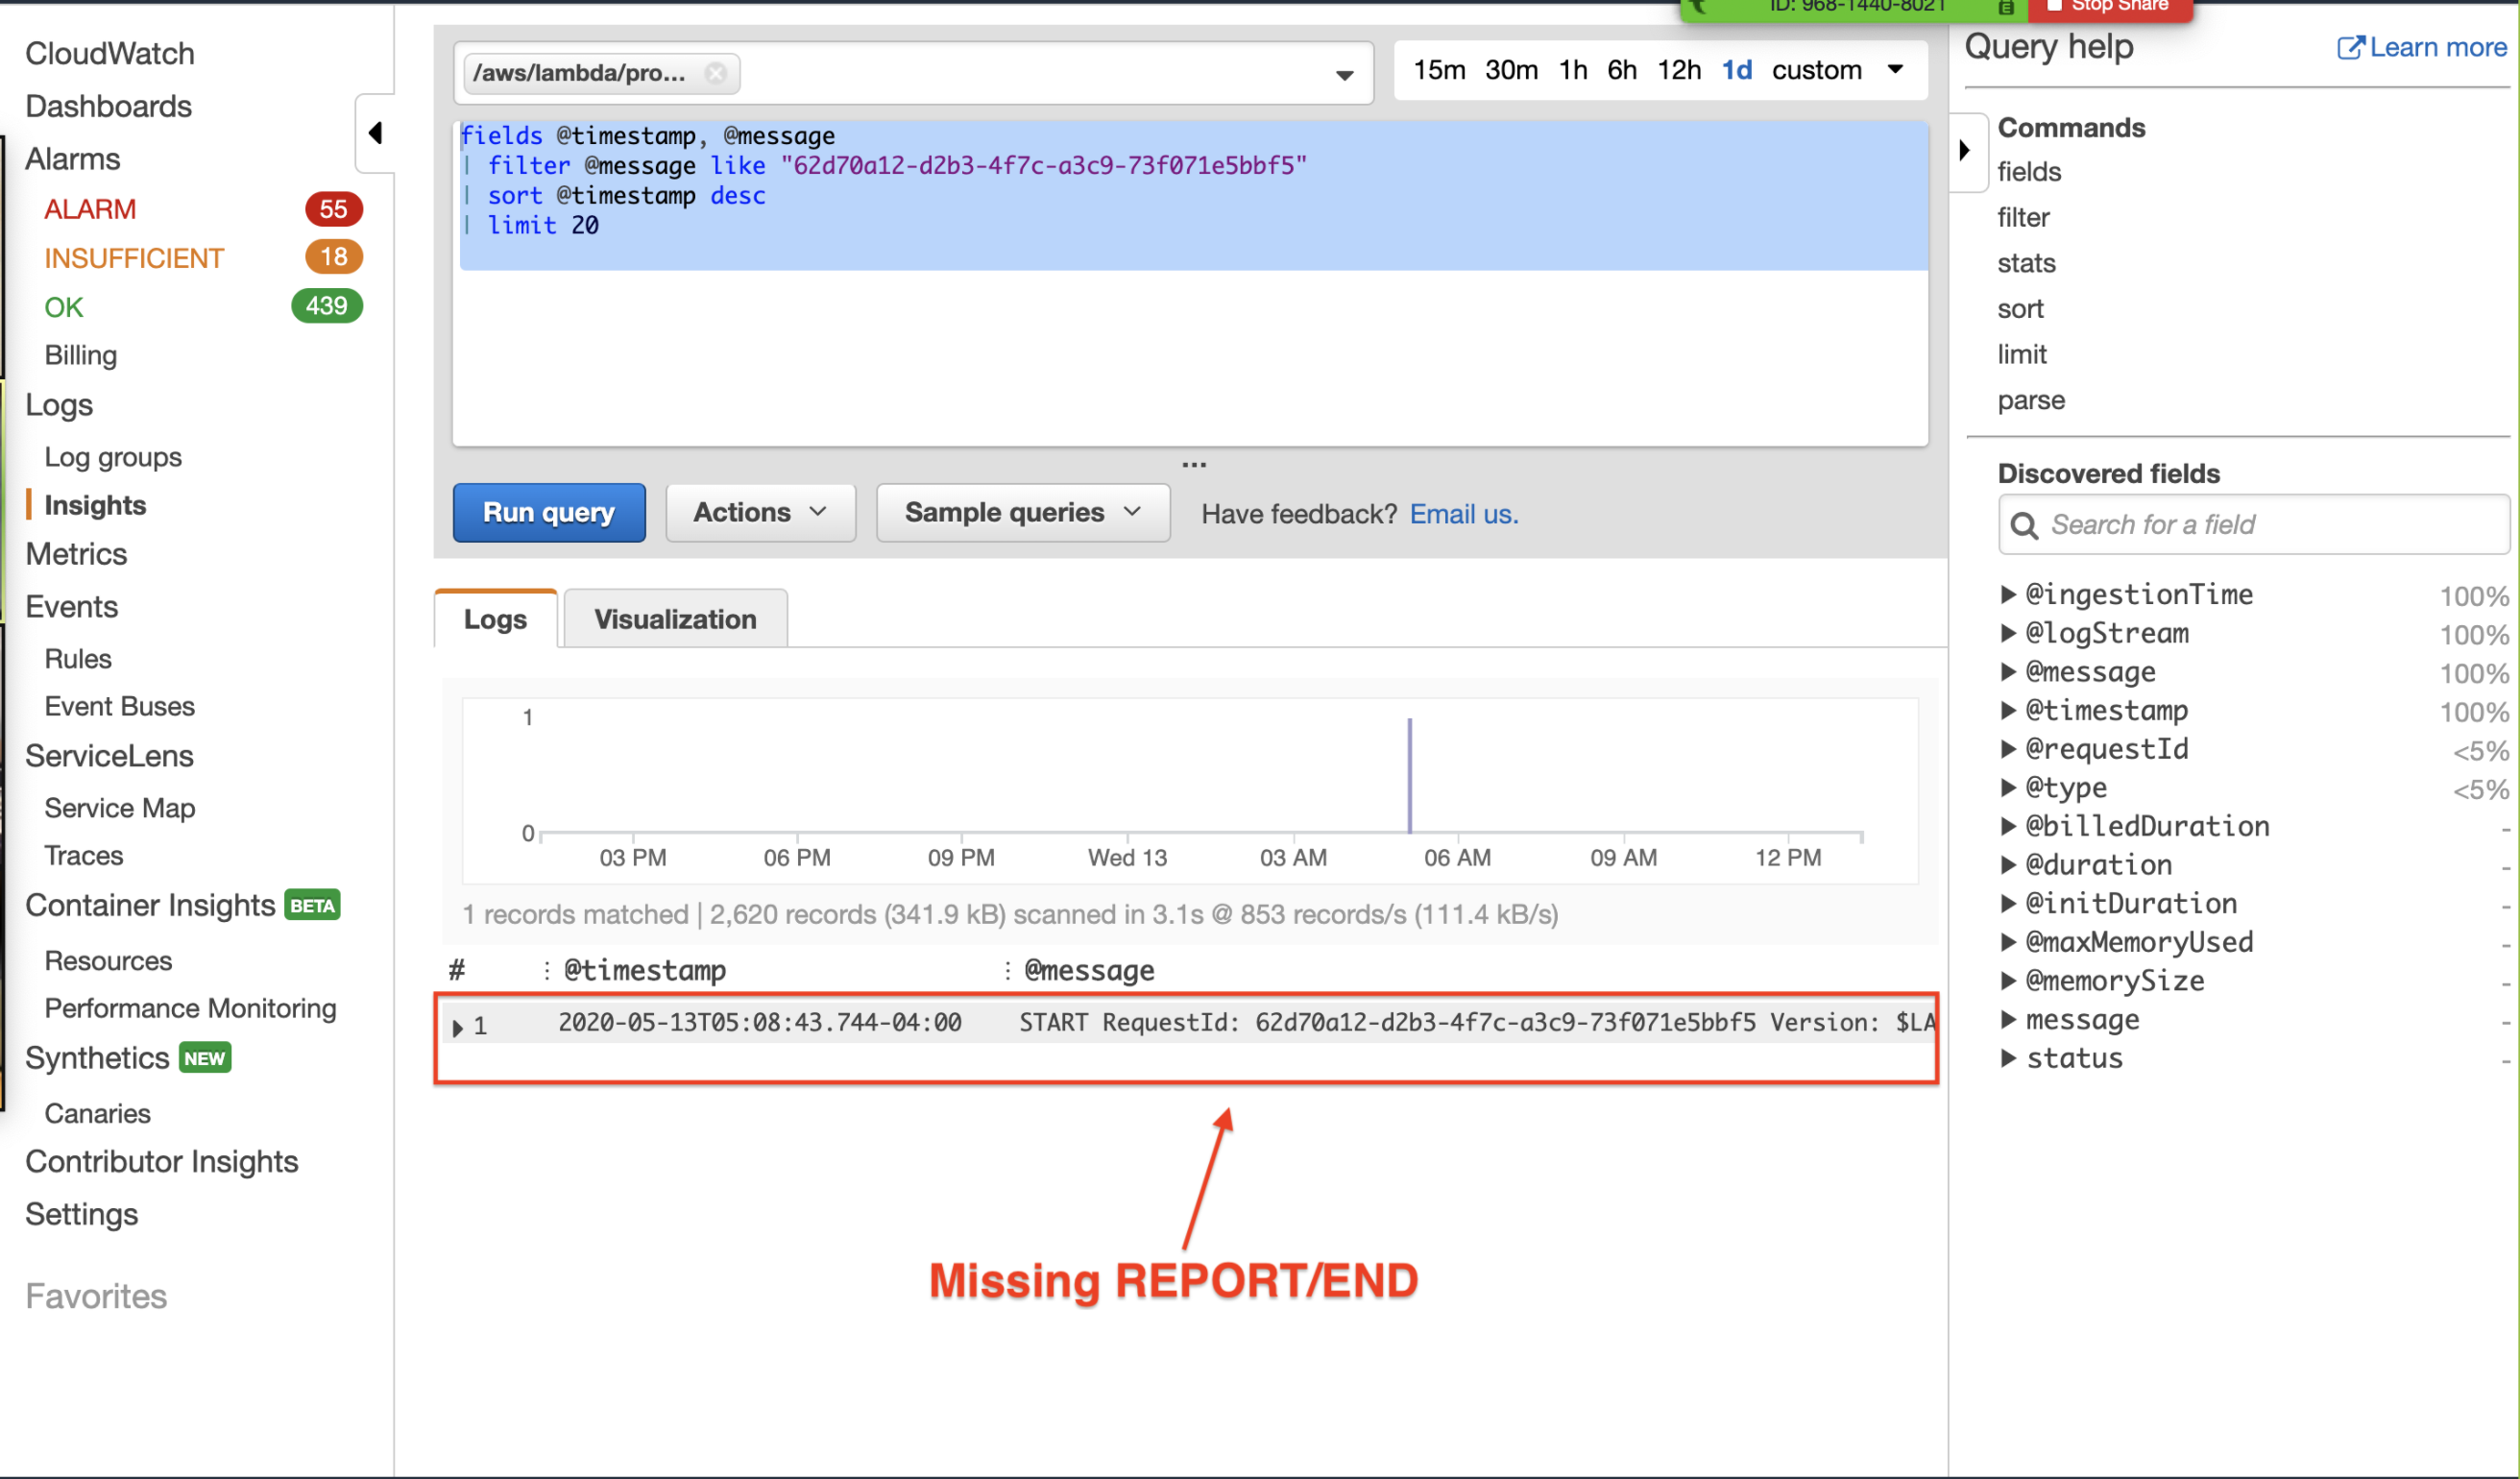
Every failed invocation was missing the REPORT and END log lines. This was confirmed using cloudwatch insights to search the logs.
A healthy invocation is shown below:
And an example of a failed invocation, which was missing log statement:
AWS Support
The next thing I did was file a ticket with AWS support. The AWS documentation states that all lambda invocations should contain the START, REPORT, and END log lines. AWS support confirmed the missing logs were unexpected and a bug on Amazon's end.
Ensuring the Rollup Script Worked
I spent a good amount of time ensuring the correctness of the rollup lambda. The lambda is written in Go, and Go is a concurrent language. A side effect of concurrency is the ability to right concurrently incorrect code. The concurrent correctness was prioritized during development by:
Designing the program to minimize race conditions by using “Monitor” Pattern, which makes it so each goroutine owns its own data, which avoids race conditions because data is never shared. Think of a team that uses google docs. If all teammates edit the same google doc at the same time its possible for one teammate to accidentally delete or overwrite another teammates work. The “Monitor” pattern is like if each teammate received their own copy of the google doc that only they accessed. It becomes impossible for one teammate to overwrite another since only a single writer exists!
Share memory by communicating... through concurrency safe channels
Auditing all dependencies to ensure that shared data is safe for concurrent use according to docs. This means finding all documentation for all concurrently accessed dependencies and verifying that they had statements like: Sessions are safe to use concurrently as long as the Session is not being modified.(AWS go sdk session documentation)
Byte by byte input and output comparisons – concurrency errors would likely result in slightly off outputs from data being overwritten or ignored. Combined with the above strategies, the fact that input and output was correct under very high concurrency and soak testing (long execution times) was a strong indicator of no race conditions
Executing the program locally many times under high concurrency
The program also worked locally without generating errors, this suggested that it was something specific to the AWS lambda execution environment.
Moving Forward
My primary focus was delivering this pipeline according to my commitment. Even though the script was erroring intermittently (a couple of times a day across all environments – ~98% reliability) I set up a dead letter queue which retried the lambda until it succeeded; ensuring that the pipeline was “done” and
the commitment was fulfilled. Even though the pipeline could process data reliably (with some retries...) it didn’t sit well that the lambda was erroring in such a strange way...
Starting to Debug
The first step I took was to remove any shared state between lambda invocations. AWS caches lambda execution environments in order to reduce lambda execution time by removing startup times. Lambdas have two types of resources:
- main scoped (or global) resources – which live outside of the handler function, and
- handler scoped resources – which are local to an individual lambda invocation
Since the lambda only executes hourly, I updated all dependencies to be handler-scoped. In a high throughput lambda this may not have been possible, because the overhead generated by re-initializing on each lambda invocation.
Errors were still present after this change.
Back to Basics
I was pretty confident in the correctness of the rollup lambda but errors were still present. Even though I had been using AWS lambda for almost 4 months, I had never actually read the official full lambda documentation from top to bottom:
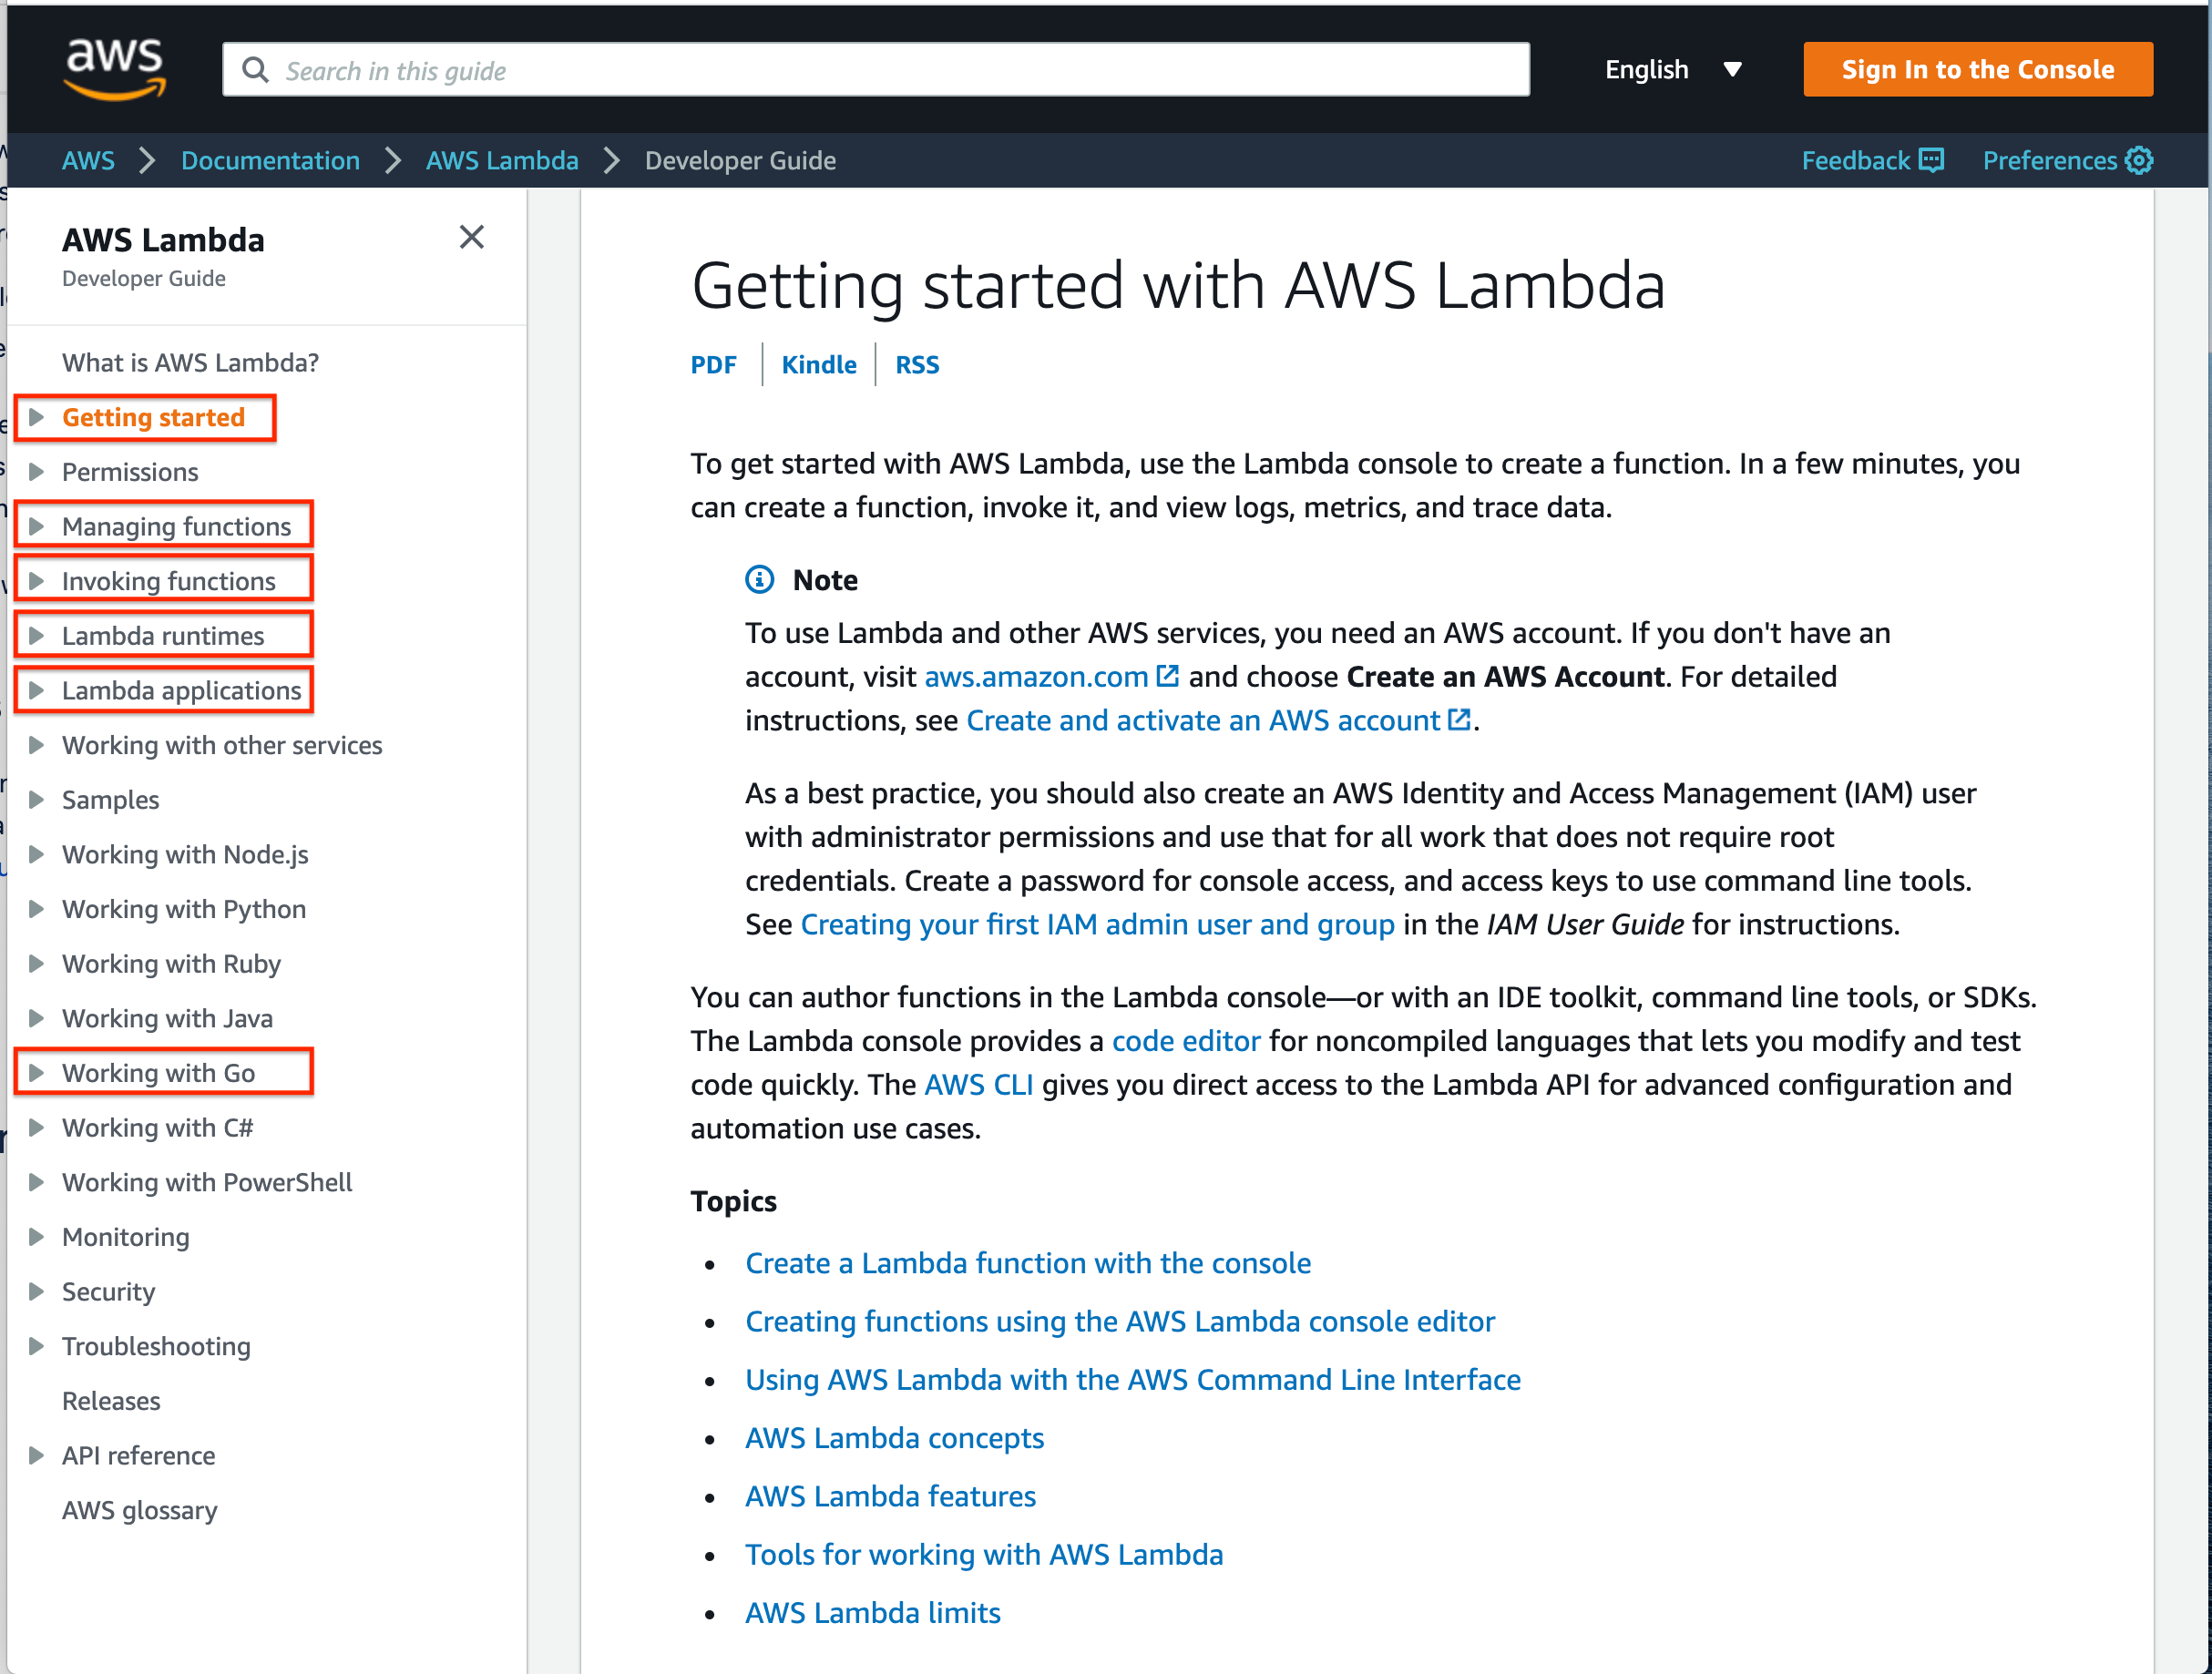
When encountering an unknown bug, I like to go back and read the docs, word for word, from top to bottom. One thing that jumped out on the “Limits” page, was a hard limit of 1024 File Descriptors on lambda invocation:
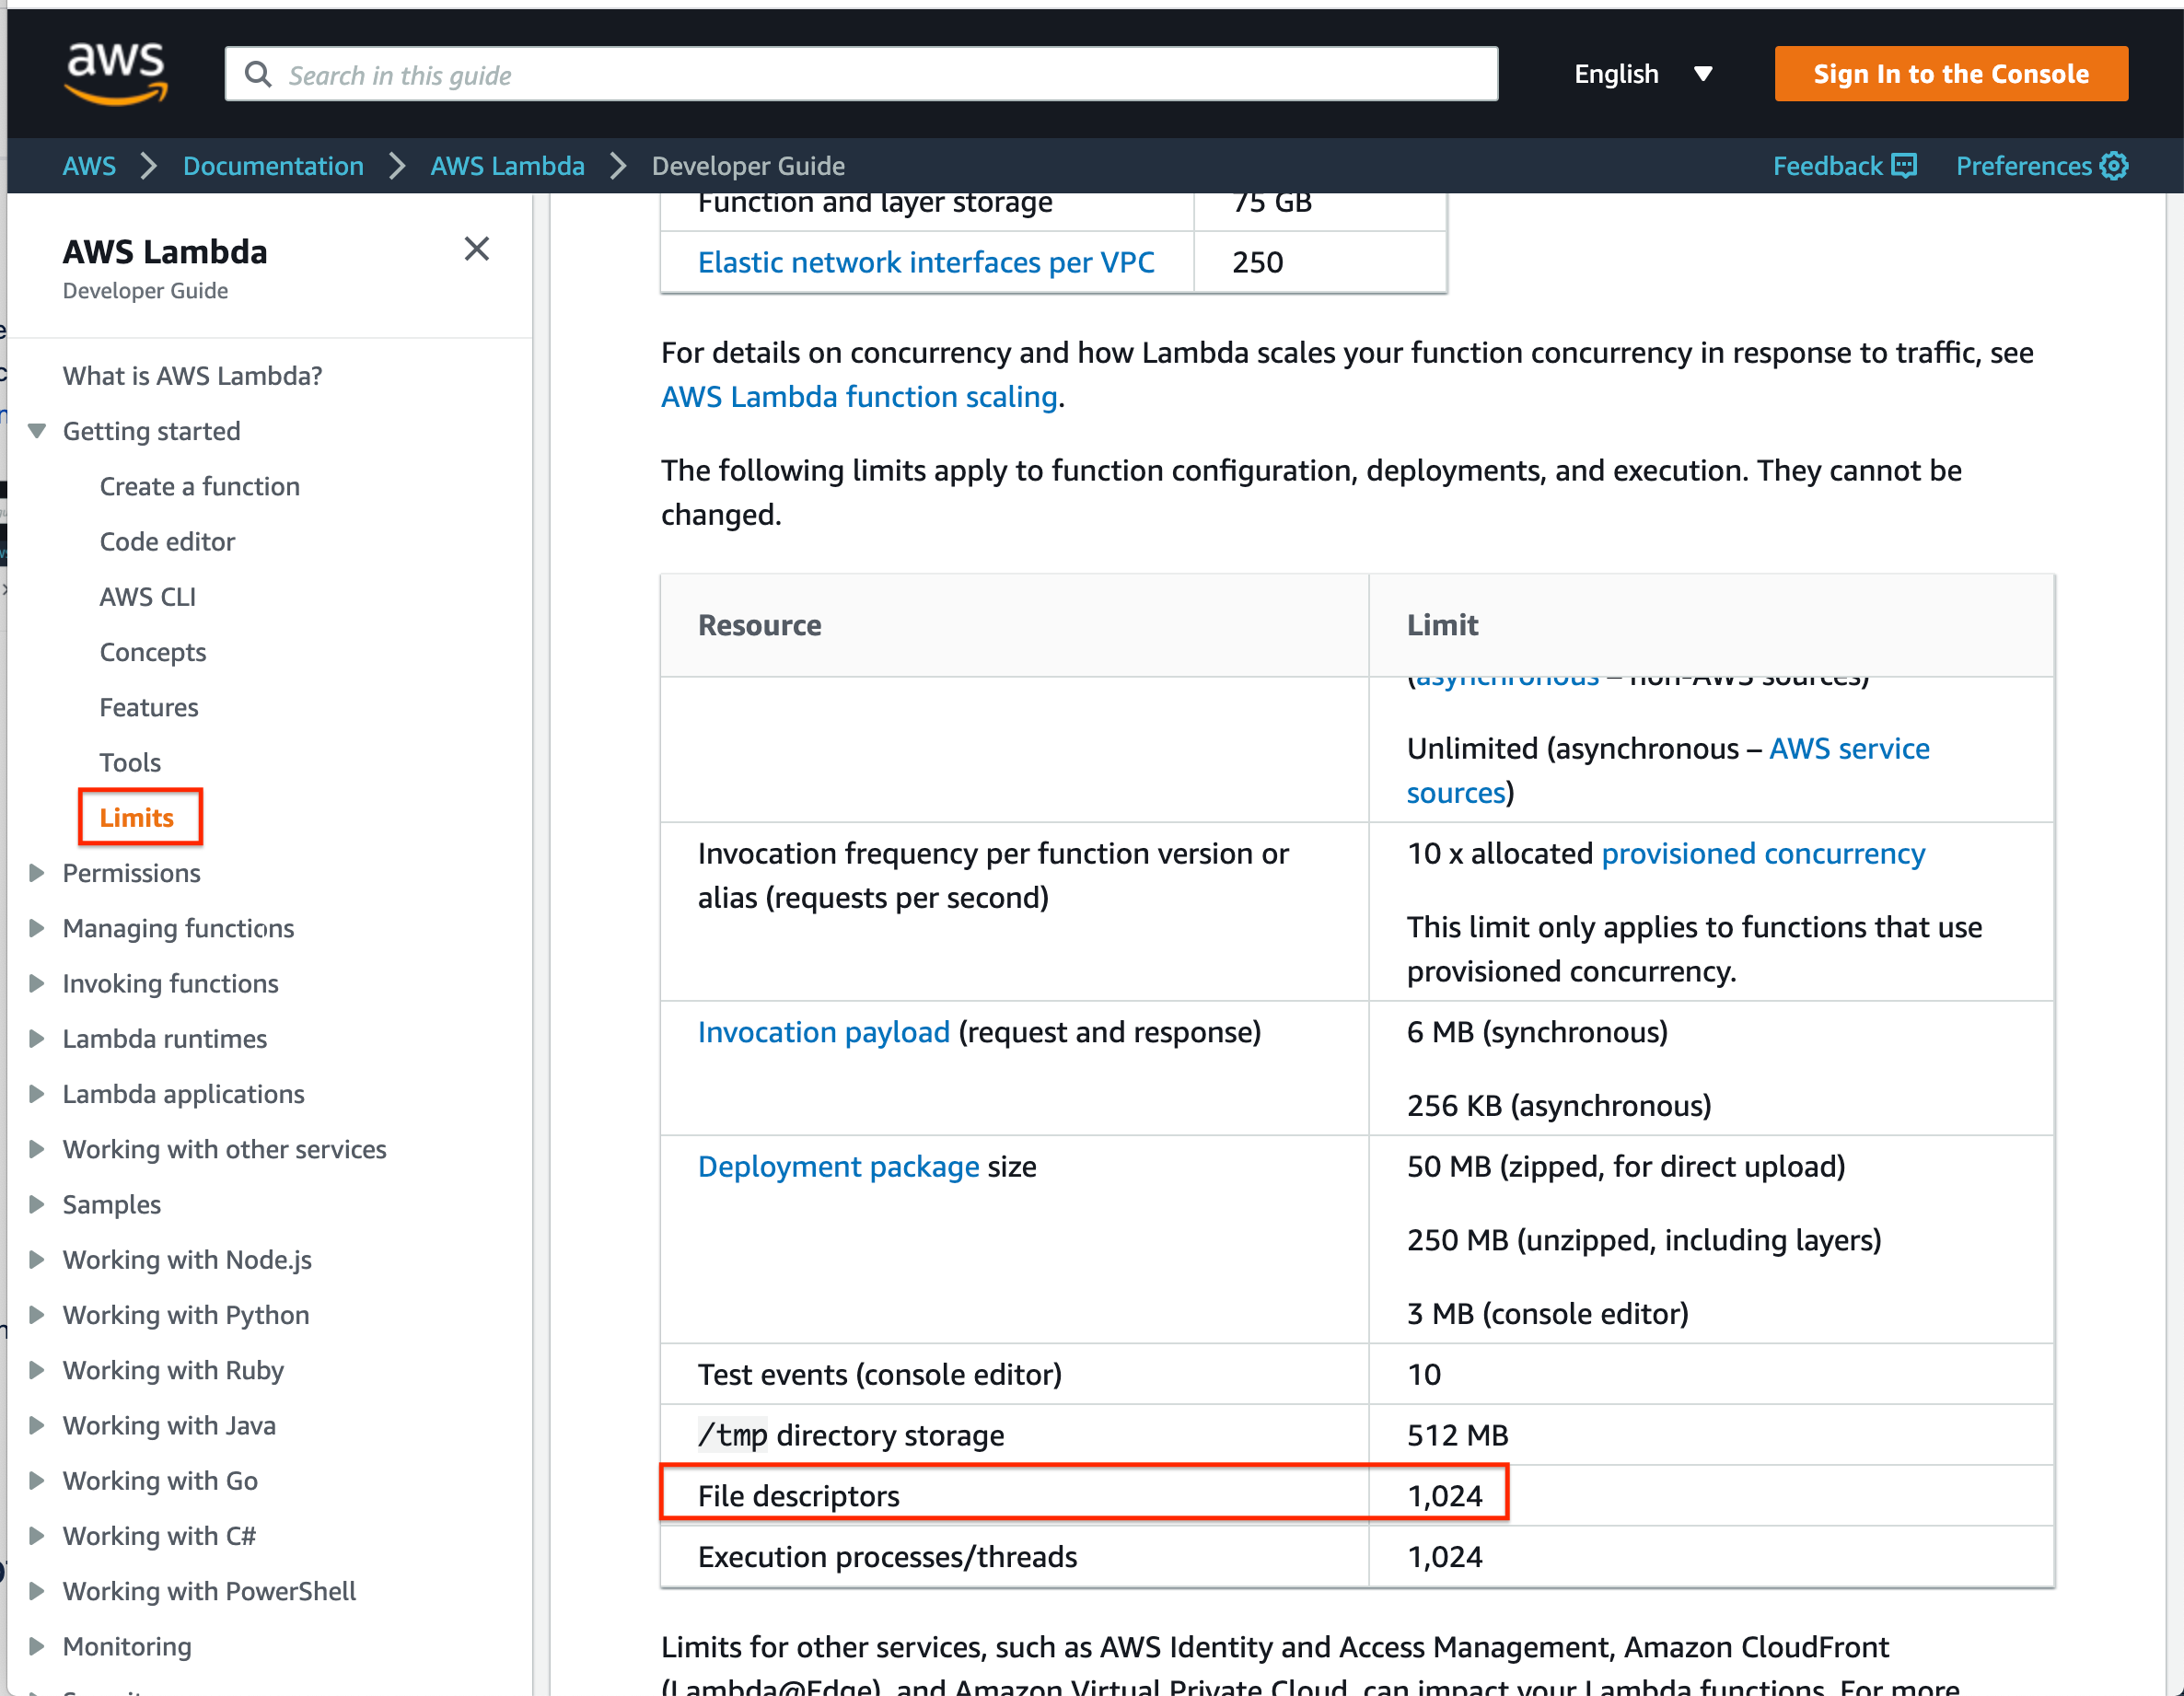
The rollup script reaches a steady state of ~1000 goroutines, if each of those goroutines held a TCP connection it’s possible to go over this limit.
Verifying Hypothesis
In order to verify the hypothesis the lambda was setup to monitor how many file descriptors it was using. I used prometheus' procfs project to query this information from the OS. The proc filesystem is not available in MacOS so the program had to be executed in linux. This required:
Adding a status loop to log the current number of file descriptors in use
Building the go binary for linux
Copying the binary to an ubuntu docker container with gatekeeper generated AWS credentials (since the program makes requests to our S3 buckets)
Invoke the program against production workloads
The status loop was setup to log the file descriptors, and # of goroutines, every 5 seconds:
done := make(chan int)

go func() {
    proc, err := procfs.NewProc(os.Getpid())
    if err != nil {
        panic(err)
    }

    t := time.NewTicker(5 * time.Second)
    for {
        select {
        case <-t.C:
            fmt.Printf("numGoroutines: %d\n", runtime.NumGoroutine())
            numFds, _ := proc.FileDescriptorsLen()
            fmt.Printf("num fds: %d\n", numFds)
        case <-done:
            fmt.Println("done status")
            return
        }
    }
}()
After executing there was peak goroutine and file descriptor usage of ~:
numGoroutines: 3683
num fds: 1715
numGoroutines: 3021
num fds: 1386
numGoroutines: 2339
num fds: 1035
This verified that the lambda regularly exceeded 1024 file descriptors for production workloads!
Bounding Resource Usage
The only file descriptors that the program used were TCP connections related to S3 connections. During the initial investigation I noticed that all the *http.Clients were using the default client (S3 Downloader, S3 Uploader and Datadog go library). I updated the lambda to provide Amazon recommended defaults, with the addition of specifying a maximum number of allowed connections per host (MaxConsPerHost):
HTTPClientSettings{
        Connect:          5 * time.Second,
        ExpectContinue:   1 * time.Second,
        IdleConn:         90 * time.Second,
        ConnKeepAlive:    30 * time.Second,
        MaxAllIdleConns:  100,
        MaxHostIdleConns: 10,
        ResponseHeader:   5 * time.Second,
        TLSHandshake:     5 * time.Second,
        MaxConnsPerHost:  250,
    },
Which is initialized like:
sess := session.Must(
  session.NewSession(
    &aws.Config{
		HTTPClient: logs.NewDefaultHTTPClientWithSettings(),
	},
  ),
),
he program was built and executed again, which resulted in a peak file descriptor usage of 256 (250 from amazon and 6 others from outside of the go aws sdk):
numGoroutines: 761
num fds: 256
Error Free!
The code was deployed to production during Thursday May 14th afternoon, and have not seen an error since!
