- Published on
How Probes Partition the Debug Space
- Authors

- Name
- Danny Mican
Probing is a technique to perform regular checks on a service using a short interval. Probes provide signals that can significantly cut down debug time. This post describe probes and how they can be used to drill down into errors and make debugging more focused; how they can partition the debug space.
Probes
Probes are targeted checks, performed as request / response actions, on a short (~1 minute or less) interval. Some common applications of probes are:
- Uptime Probes: Internal Debugging - The focus of this post. Probes make a binary Yes/No determination of if a service is functioning as expected.
- Load balancer health checks - Amazon ELB defaults to 30 second health checks
- Uptime Probes: Status Pages - Feed uptime data for presentation to end users.
- Uptime Probes: SRE - Provides SLI/SLO data, related to status pages above.
Probes are a critical component of status pages and customer facing health metrics. Companies often use probes to provide Yes|no down up determinations as the data for their status pages. Think of Pingdom or a load balancer which requests a website every minute to determine if the site is up or not.
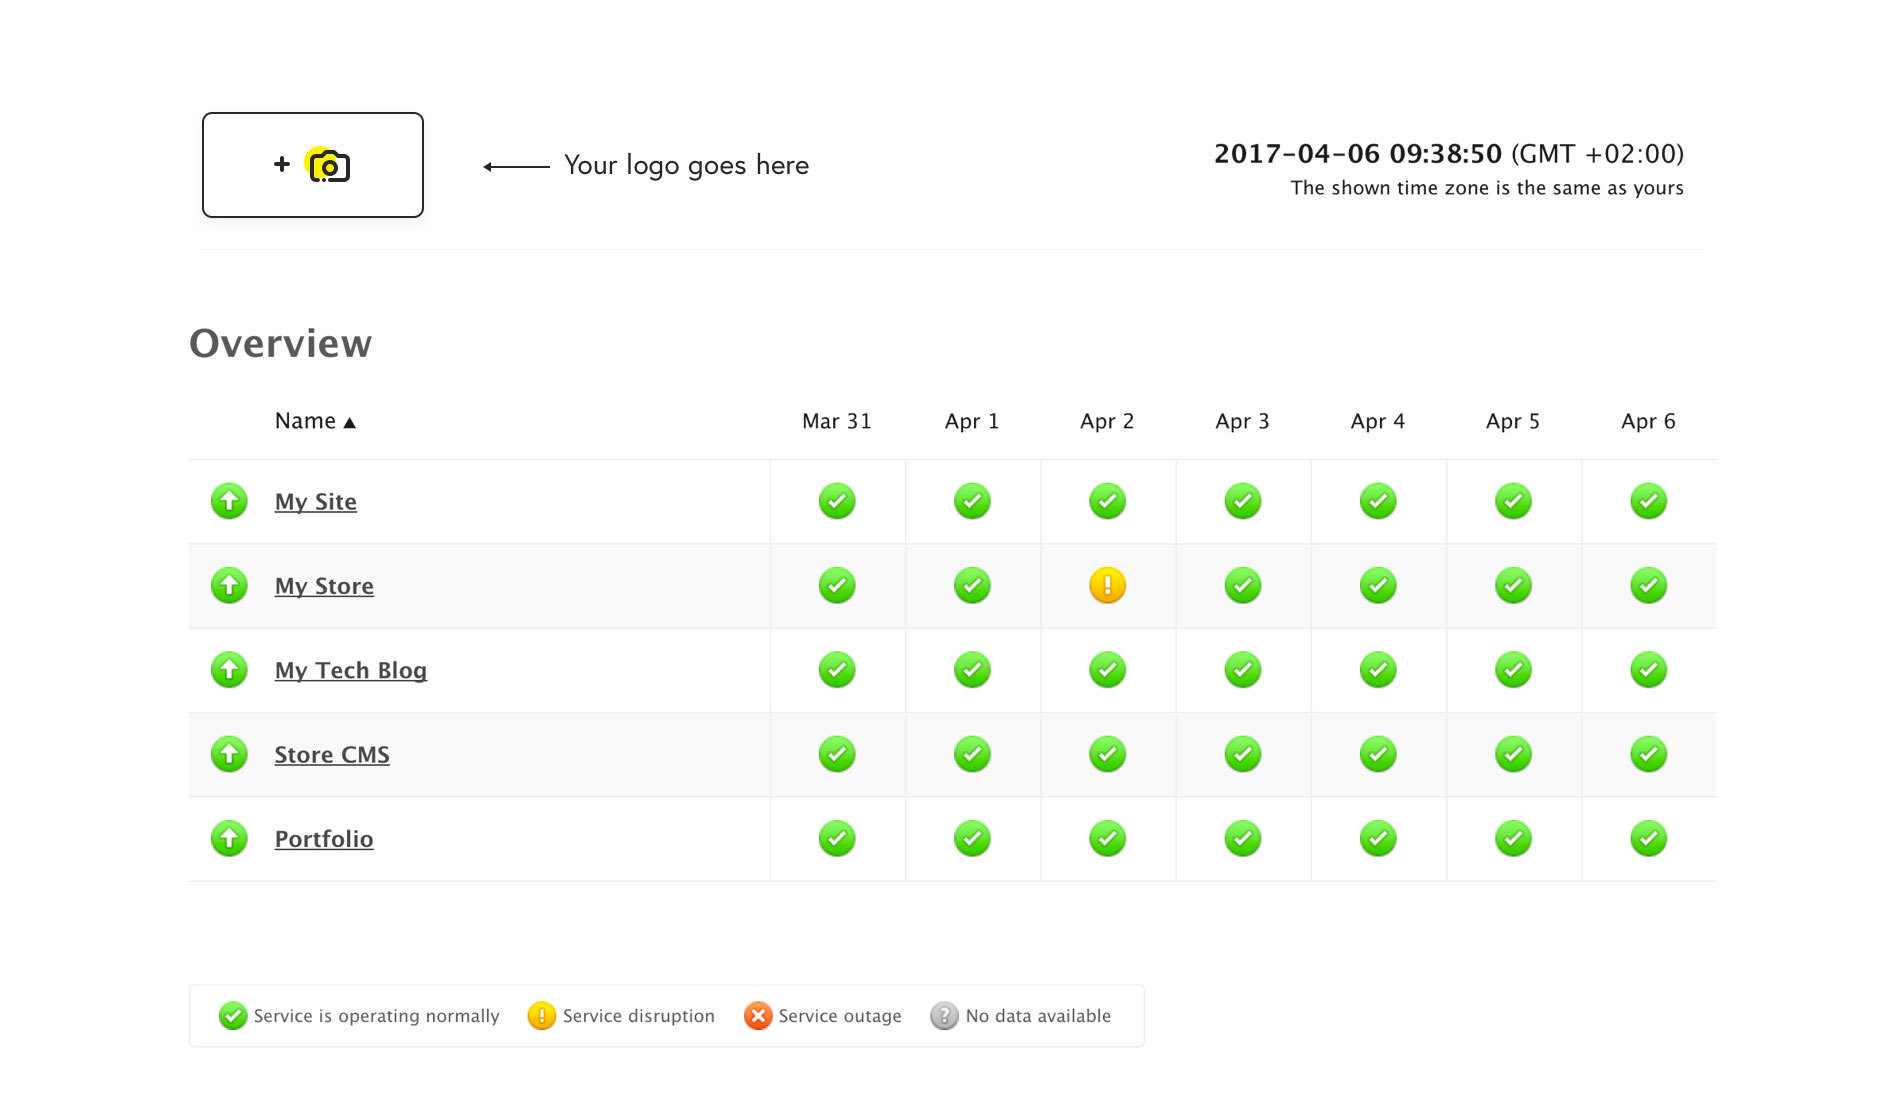
(Pingdom status page. Source Pingdom)
Common solutions to implement probes are:
- SAAS (Pingdom, DataDog)
- Open-source (Google CloudProber)
- Built-in to Load Balancers/Cloud Components
- Homegrown probing on an interval
Output
Probes are most effective when they return a binary yes|no result and the latency to achieve the result. Since probes are synthetic the expected results are known before hand. The follow describes a prober to check backend health from a load balancer:
- Protocol HTTP
- Target Endpoint /health
- Success: 200 Status code
The above probe defines success as 200 and failure as any other status code. The status code in this case isn't important, only the binary success|failure determination.
Graphing the probe above would look like a timeseries of invocations with their success and failures:
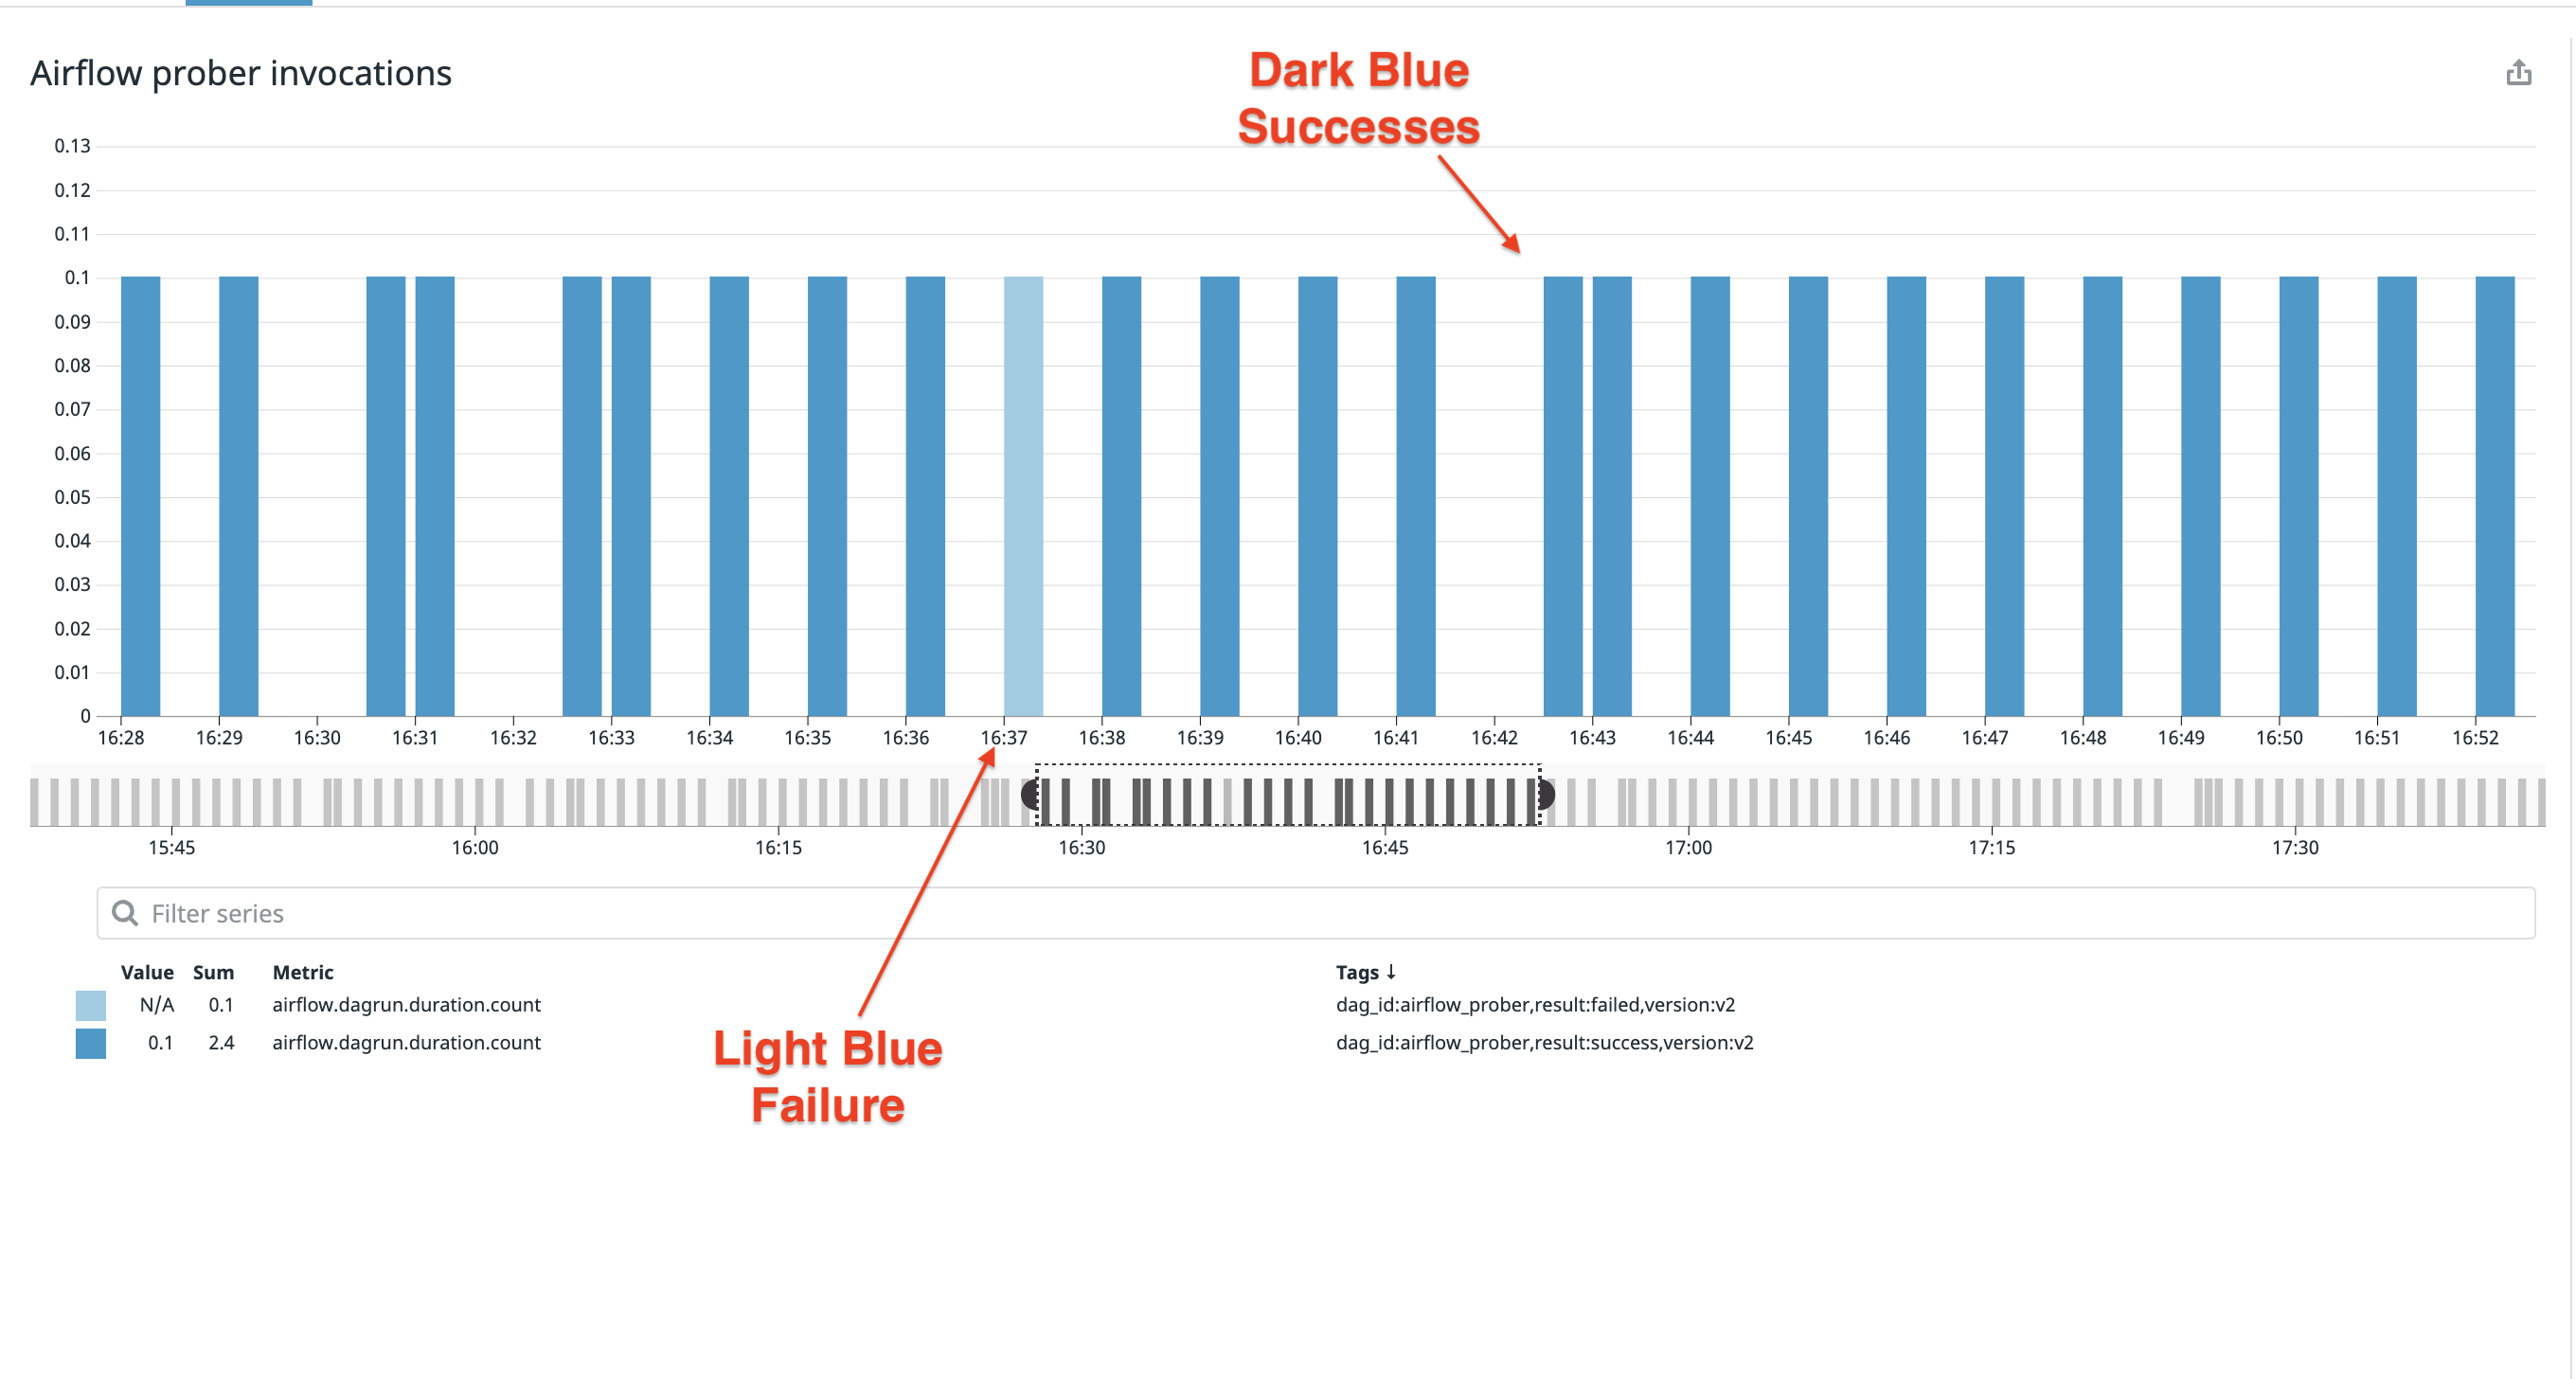
If you're wondering why the graph above isn't uniform, it's because the metrics are being reported by the system at delayed intervals. The chart below shows the actual prober executions are uniform:

It's also common to see probes aggregated and expressed as a ratio between success and failure:

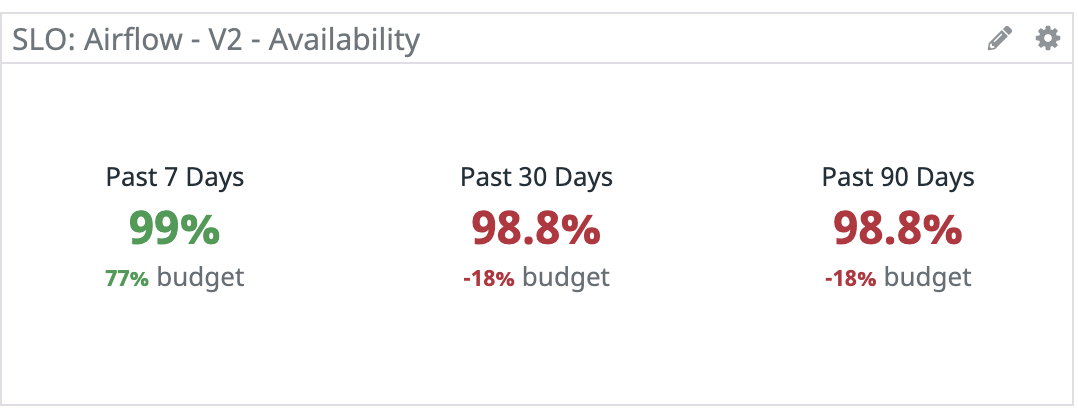
Probe results can be rolled up over larger intervals to calculate aggregate availability. The following examples shows the aggregate availability over 7, 30 and 90 days:
Probes are very simple, they contain the following properties:
- Protocol
- Target
- Expected response
- Interval
Google CloudProber contains an example of the config required for a production-ready self hosted solution. These simple operations are the building blocks to determining if services are up or down, client reporting, debugging, reliability, and load balancer targets, among others.
Debugging Using Probes
The binary success|failure output probes generate make them well suited to debugging. Probes can be used to partition of the debug space along critical & common inflection points. Imagine a service with external customers, the customers complain that something is wrong. An effective debugging workflow takes an huge or unbounded debug space and narrows it down:
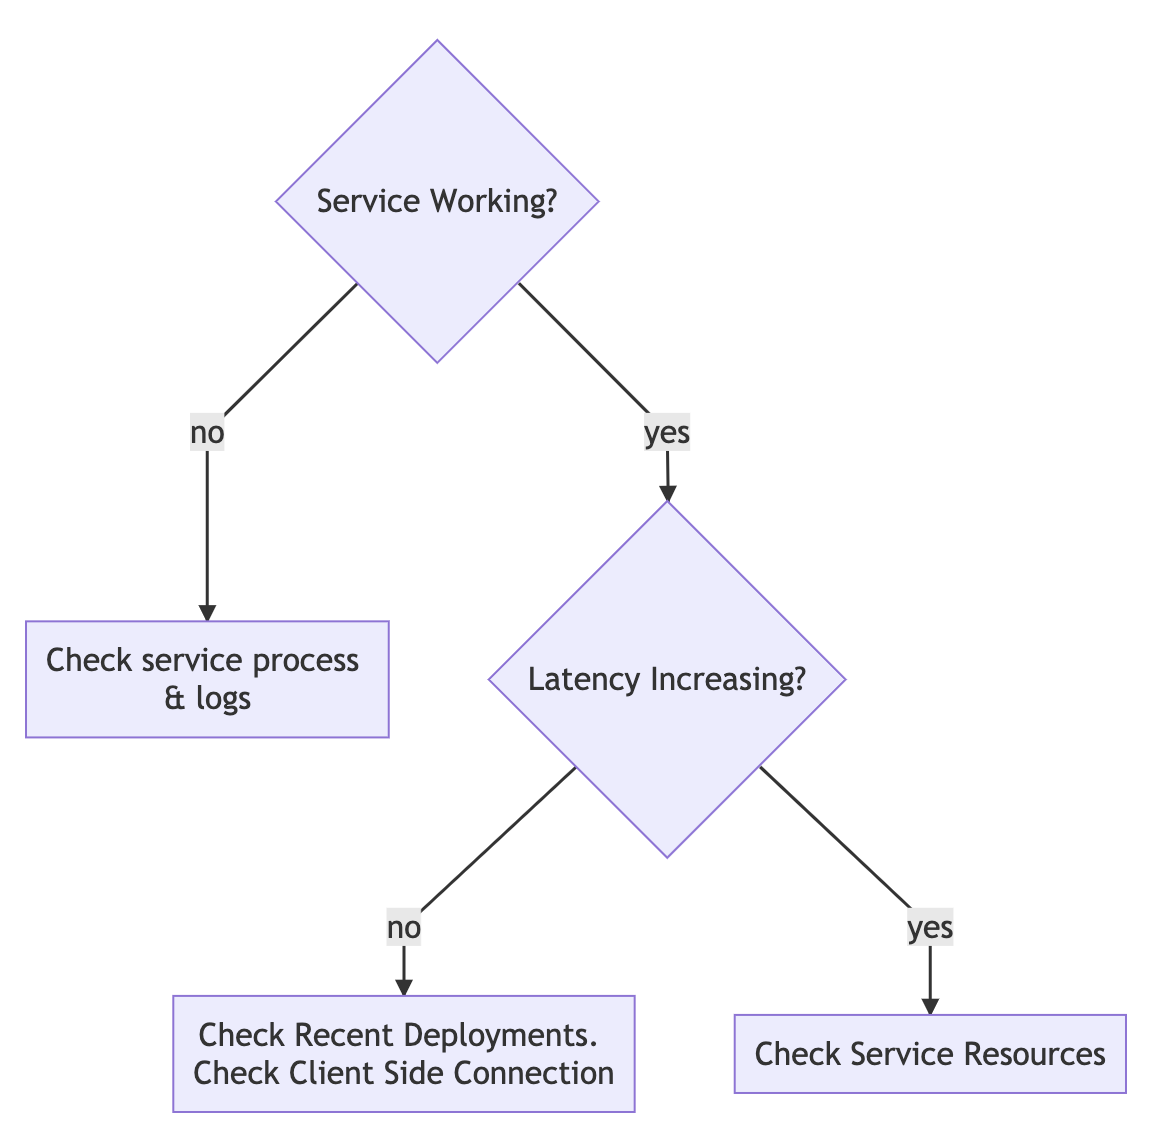
The goal of debugging and the flowchart above is to take a large problem space, "Service is not working" and drill down into the causes. With each question the debug space gets smaller and more targeted. This can be visualized as a bounded space, where each question partitions the space in half. Good debug questions will binary search the space along critical inflection points:
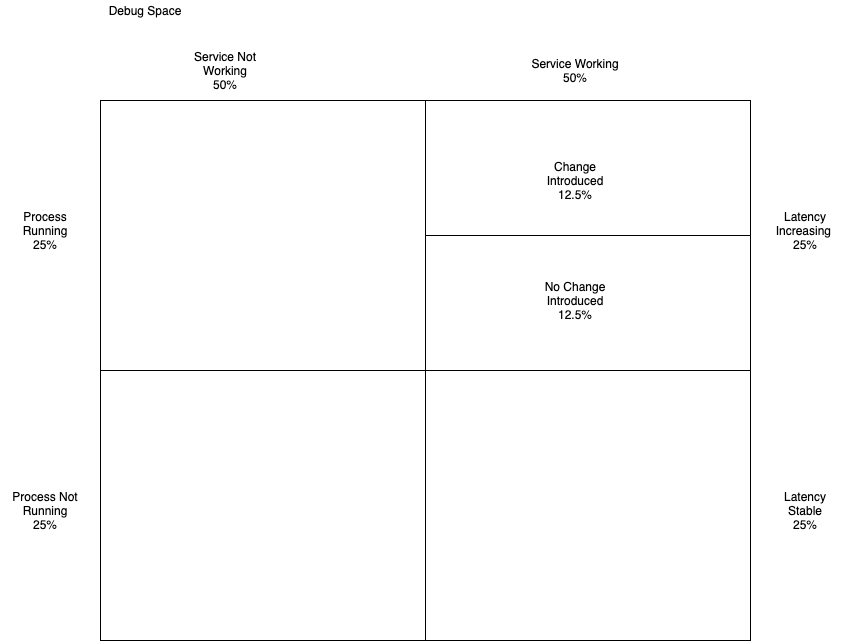
Probes can be used to test these inflection points and make it trivial to dig into the problem space. To partition the debug space using the questions above only a single probe is needed. This probe needs to measure success and latency.
A single probe per service significantly partitions the debug space using just availability and latency.
A prober per service may seem like a lot of moving parts but I have found probes to be extremely easy to maintain. The requirements to execute them are pretty small. Their focused nature makes it trivial to write probe logic and the fact that they execute on an interval makes them easy to operate.
Probes are a primitive operational tool and are critical for debugging. I find systems with probes are easier to debug and determine if they are running. Probes also provide information to external stakeholders on system health.
Happy Probing!!